메모
전체 예제 코드를 다운로드 하려면 여기 를 클릭 하십시오.
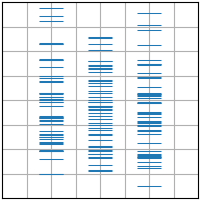
이벤트플롯(D) #
참조하십시오 eventplot.

import matplotlib.pyplot as plt
import numpy as np

plt.style.use('_mpl-gallery')

# make data:
np.random.seed(1)
x = [2, 4, 6]
D = np.random.gamma(4, size=(3, 50))

# plot:
fig, ax = plt.subplots()

ax.eventplot(D, orientation="vertical", lineoffsets=x, linewidth=0.75)

ax.set(xlim=(0, 8), xticks=np.arange(1, 8),
       ylim=(0, 8), yticks=np.arange(1, 8))

plt.show()