메모
전체 예제 코드를 다운로드 하려면 여기 를 클릭 하십시오.
제한된 레이아웃 가이드 #
제한된 레이아웃을 사용하여 그림 내에 플롯을 깔끔하게 맞추는 방법.
constrained_layout 은 사용자가 요청한 논리적 레이아웃을 최대한 유지하면서 그림 창에 맞도록 범례 및 색상 막대와 같은 서브플롯 및 장식을 자동으로 조정합니다.
constrained_layout 은 tight_layout 과 유사 하지만 제약 조건 해결기를 사용하여 축이 맞도록 허용하는 축의 크기를 결정합니다.
constrained_layout 은 일반적으로 그림에 축을 추가하기 전에 활성화해야 합니다. 그렇게 하는 두 가지 방법은 다음과 같습니다.
subplots()또는 에 대한 각각의 인수 사용figure(), 예:plt.subplots(layout="constrained")
다음과 같이 rcParams 를 통해 활성화하십시오 .
plt.rcParams['figure.constrained_layout.use'] = True
다음 섹션에서 자세히 설명합니다.
간단한 예 #
Matplotlib에서 축(서브플롯 포함)의 위치는 정규화된 그림 좌표로 지정됩니다. 축 레이블이나 제목(또는 경우에 따라 눈금 레이블)이 그림 영역을 벗어나서 잘릴 수 있습니다.
import matplotlib.pyplot as plt
import matplotlib.colors as mcolors
import matplotlib.gridspec as gridspec
import numpy as np

plt.rcParams['savefig.facecolor'] = "0.8"
plt.rcParams['figure.figsize'] = 4.5, 4.
plt.rcParams['figure.max_open_warning'] = 50


def example_plot(ax, fontsize=12, hide_labels=False):
    ax.plot([1, 2])

    ax.locator_params(nbins=3)
    if hide_labels:
        ax.set_xticklabels([])
        ax.set_yticklabels([])
    else:
        ax.set_xlabel('x-label', fontsize=fontsize)
        ax.set_ylabel('y-label', fontsize=fontsize)
        ax.set_title('Title', fontsize=fontsize)

fig, ax = plt.subplots(layout=None)
example_plot(ax, fontsize=24)
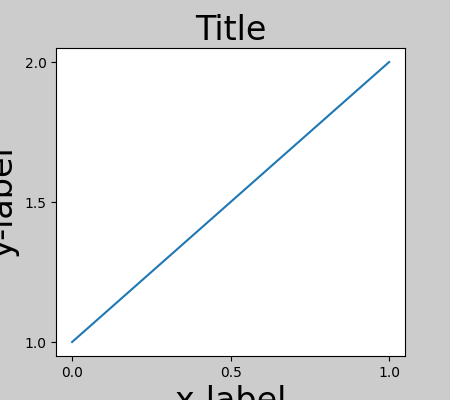
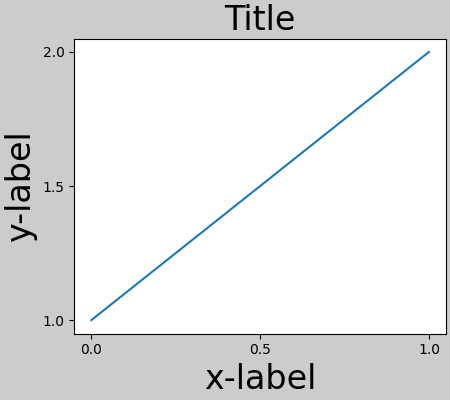
이를 방지하기 위해 축의 위치를 조정해야 합니다. 서브플롯의 경우 를 사용하여 서브플롯 매개변수를 조정하여 수동으로 수행할 수 있습니다 Figure.subplots_adjust. 그러나 # layout="constrained"키워드 인수로 그림을 지정하면 # 자동으로 조정됩니다.
fig, ax = plt.subplots(layout="constrained")
example_plot(ax, fontsize=24)
서브플롯이 여러 개인 경우 종종 서로 다른 축의 레이블이 서로 겹치는 것을 볼 수 있습니다.
fig, axs = plt.subplots(2, 2, layout=None)
for ax in axs.flat:
    example_plot(ax)
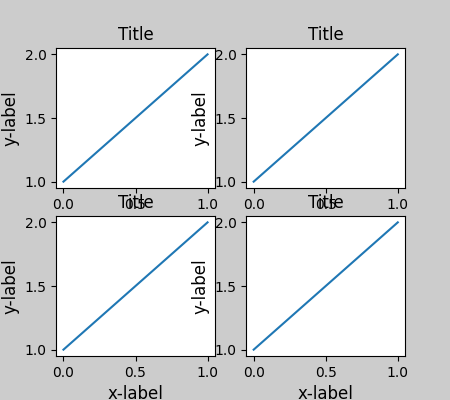
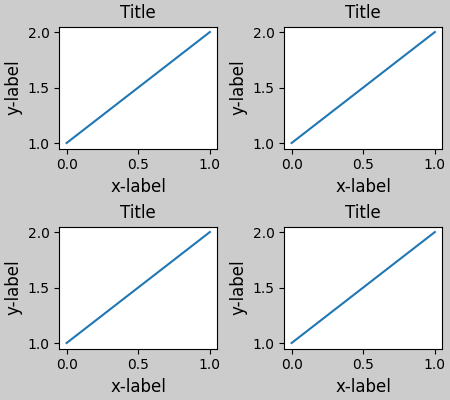
layout="constrained"호출에서 지정 plt.subplots
하면 레이아웃이 적절하게 제한됩니다.
fig, axs = plt.subplots(2, 2, layout="constrained")
for ax in axs.flat:
    example_plot(ax)
컬러바 #
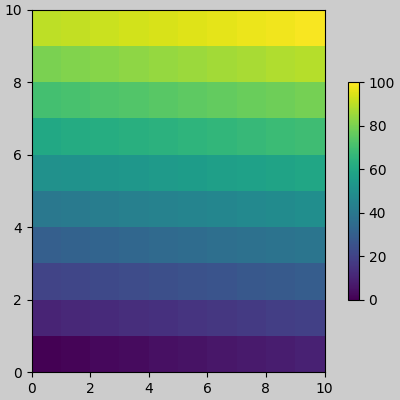
를 사용하여 컬러바를 생성하는 경우 Figure.colorbar이를 위한 공간을 만들어야 합니다. constrained_layout이 작업을 자동으로 수행합니다. use_gridspec=True이 옵션은 를 통해 레이아웃을 개선하기 위해 만들어졌기 때문에
지정 하면 무시됩니다 tight_layout.
메모
pcolormesh키워드 인수( ) 에는 pc_kwargs사전을 사용합니다. 아래에서는 각각을 포함하는 여러 축에 하나의 컬러바를 할당합니다 ScalarMappable. 노름과 컬러맵을 지정하면 컬러바가 모든 축에 대해 정확합니다.
arr = np.arange(100).reshape((10, 10))
norm = mcolors.Normalize(vmin=0., vmax=100.)
# see note above: this makes all pcolormesh calls consistent:
pc_kwargs = {'rasterized': True, 'cmap': 'viridis', 'norm': norm}
fig, ax = plt.subplots(figsize=(4, 4), layout="constrained")
im = ax.pcolormesh(arr, **pc_kwargs)
fig.colorbar(im, ax=ax, shrink=0.6)
<matplotlib.colorbar.Colorbar object at 0x7f2cfafb53c0>
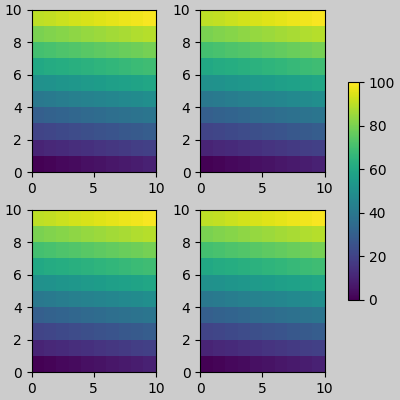
ax의 인수에 축 목록(또는 다른 반복 가능한 컨테이너)을
colorbar지정하면 constrained_layout이 지정된 축에서 공간을 차지합니다.
fig, axs = plt.subplots(2, 2, figsize=(4, 4), layout="constrained")
for ax in axs.flat:
    im = ax.pcolormesh(arr, **pc_kwargs)
fig.colorbar(im, ax=axs, shrink=0.6)
<matplotlib.colorbar.Colorbar object at 0x7f2cfb6eed70>
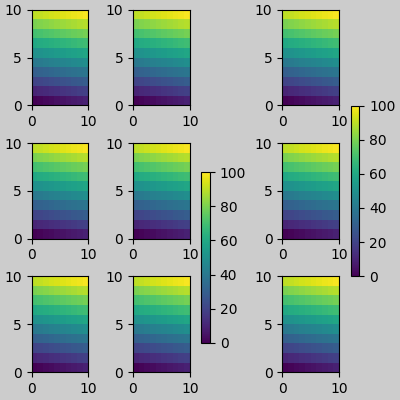
축 그리드 내부에서 축 목록을 지정하면 컬러바가 적절하게 공간을 차지하고 간격을 남기지만 모든 서브플롯의 크기는 여전히 동일합니다.
fig, axs = plt.subplots(3, 3, figsize=(4, 4), layout="constrained")
for ax in axs.flat:
    im = ax.pcolormesh(arr, **pc_kwargs)
fig.colorbar(im, ax=axs[1:, ][:, 1], shrink=0.8)
fig.colorbar(im, ax=axs[:, -1], shrink=0.6)
<matplotlib.colorbar.Colorbar object at 0x7f2cdd1a3340>
자막 #
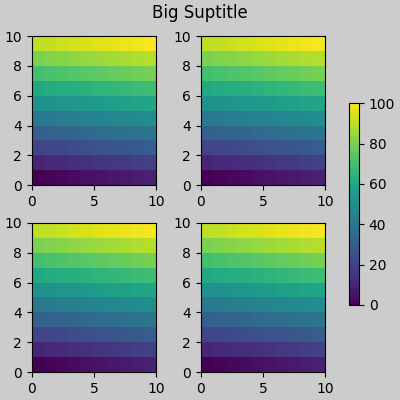
constrained_layout위한 공간을 만들 수도 있습니다 suptitle.
fig, axs = plt.subplots(2, 2, figsize=(4, 4), layout="constrained")
for ax in axs.flat:
    im = ax.pcolormesh(arr, **pc_kwargs)
fig.colorbar(im, ax=axs, shrink=0.6)
fig.suptitle('Big Suptitle')
Text(0.5, 0.9895825, 'Big Suptitle')
전설 #
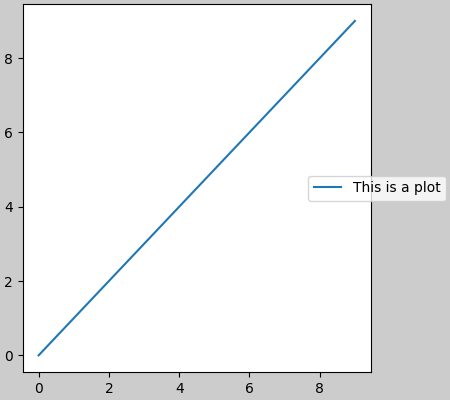
범례는 상위 축 외부에 배치할 수 있습니다. 제한된 레이아웃은 Axes.legend(). 그러나 제한된 레이아웃은 (아직) 을 통해 생성되는 범례를 처리
하지 않습니다 .Figure.legend()
fig, ax = plt.subplots(layout="constrained")
ax.plot(np.arange(10), label='This is a plot')
ax.legend(loc='center left', bbox_to_anchor=(0.8, 0.5))
<matplotlib.legend.Legend object at 0x7f2cfb266d70>
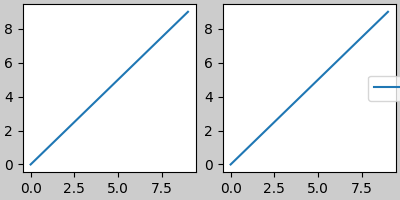
그러나 이것은 서브플롯 레이아웃에서 공간을 훔칩니다.
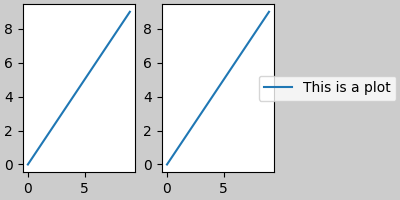
<matplotlib.legend.Legend object at 0x7f2cf99852a0>
전설이나 다른 아티스트가 서브플롯 레이아웃에서 공간을 훔치지 않도록leg.set_in_layout(False) 하기 위해 우리는 할 수 있습니다 . 물론 이것은 범례가 잘린 것을 의미할 수 있지만 플롯이 이후에 로 호출되는 경우 유용할 수 있습니다 . 그러나 저장된 파일이 작동하려면 범례의 상태를 다시 토글해야 하며 인쇄하기 전에 constrained_layout이 축 크기를 조정하도록 하려면 수동으로 그리기를 트리거해야 합니다.fig.savefig('outname.png', bbox_inches='tight')get_in_layout
fig, axs = plt.subplots(1, 2, figsize=(4, 2), layout="constrained")

axs[0].plot(np.arange(10))
axs[1].plot(np.arange(10), label='This is a plot')
leg = axs[1].legend(loc='center left', bbox_to_anchor=(0.8, 0.5))
leg.set_in_layout(False)
# trigger a draw so that constrained_layout is executed once
# before we turn it off when printing....
fig.canvas.draw()
# we want the legend included in the bbox_inches='tight' calcs.
leg.set_in_layout(True)
# we don't want the layout to change at this point.
fig.set_layout_engine(None)
try:
    fig.savefig('../../doc/_static/constrained_layout_1b.png',
                bbox_inches='tight', dpi=100)
except FileNotFoundError:
    # this allows the script to keep going if run interactively and
    # the directory above doesn't exist
    pass
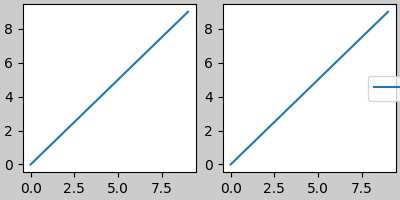
저장된 파일은 다음과 같습니다.
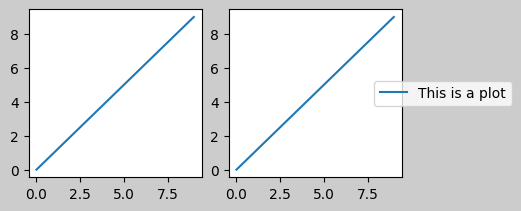
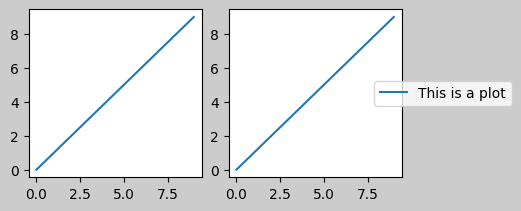
이 어색함을 피하는 더 좋은 방법은 다음에서 제공하는 범례 방법을 사용하는 것입니다 Figure.legend.
fig, axs = plt.subplots(1, 2, figsize=(4, 2), layout="constrained")
axs[0].plot(np.arange(10))
lines = axs[1].plot(np.arange(10), label='This is a plot')
labels = [l.get_label() for l in lines]
leg = fig.legend(lines, labels, loc='center left',
                 bbox_to_anchor=(0.8, 0.5), bbox_transform=axs[1].transAxes)
try:
    fig.savefig('../../doc/_static/constrained_layout_2b.png',
                bbox_inches='tight', dpi=100)
except FileNotFoundError:
    # this allows the script to keep going if run interactively and
    # the directory above doesn't exist
    pass
저장된 파일은 다음과 같습니다.
패딩 및 간격 #
축 사이의 패딩은 w_pad 및
wspace 에 의해 수평으로 제어되고 h_pad 및 hspace 에 의해 수직으로 제어됩니다 . 를 통해 편집할 수 있습니다 set. w/h_pad 는 축 주변의 최소 공간(인치 단위)입니다.
fig, axs = plt.subplots(2, 2, layout="constrained")
for ax in axs.flat:
    example_plot(ax, hide_labels=True)
fig.get_layout_engine().set(w_pad=4 / 72, h_pad=4 / 72, hspace=0,
                            wspace=0)
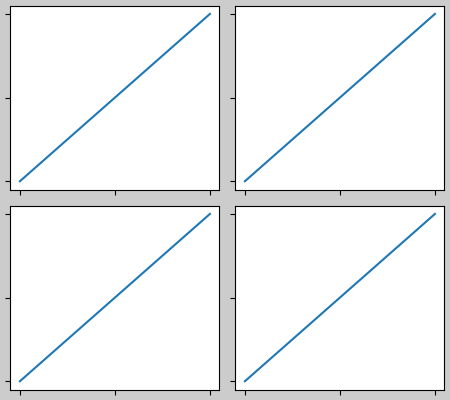
서브플롯 사이의 간격은 wspace 및 hspace 에 의해 추가로 설정됩니다 . 이들은 서브플롯 그룹 전체 크기의 일부로 지정됩니다. 이 값이 w_pad 또는 h_pad 보다 작으면 고정 패드가 대신 사용됩니다. 가장자리의 공간이 위에서 어떻게 변경되지 않는지 아래에서 참고하십시오. 그러나 서브플롯 사이의 공간은 변경됩니다.
fig, axs = plt.subplots(2, 2, layout="constrained")
for ax in axs.flat:
    example_plot(ax, hide_labels=True)
fig.get_layout_engine().set(w_pad=4 / 72, h_pad=4 / 72, hspace=0.2,
                            wspace=0.2)
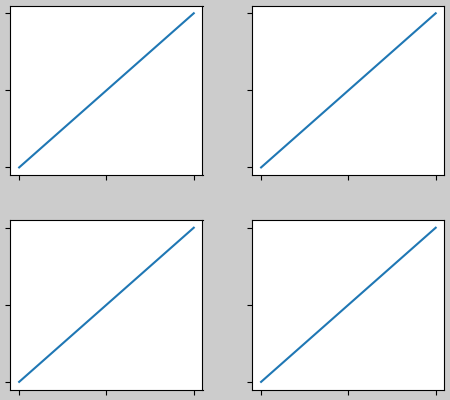
두 개 이상의 열이 있는 경우 wspace 는 그들 사이에서 공유되므로 여기에서 wspace는 2로 나뉘며 각 열 사이 의 wspace 는 0.1입니다.
fig, axs = plt.subplots(2, 3, layout="constrained")
for ax in axs.flat:
    example_plot(ax, hide_labels=True)
fig.get_layout_engine().set(w_pad=4 / 72, h_pad=4 / 72, hspace=0.2,
                            wspace=0.2)
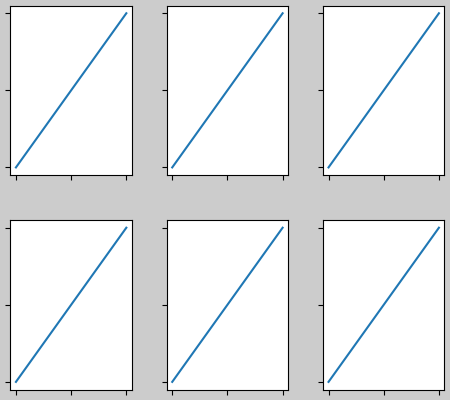
GridSpecs에는 선택적 hspace 및 wspace 키워드 인수가 있으며, 이는 다음에서 설정한 패드 대신 사용됩니다 constrained_layout.
fig, axs = plt.subplots(2, 2, layout="constrained",
                        gridspec_kw={'wspace': 0.3, 'hspace': 0.2})
for ax in axs.flat:
    example_plot(ax, hide_labels=True)
# this has no effect because the space set in the gridspec trumps the
# space set in constrained_layout.
fig.get_layout_engine().set(w_pad=4 / 72, h_pad=4 / 72, hspace=0.0,
                            wspace=0.0)
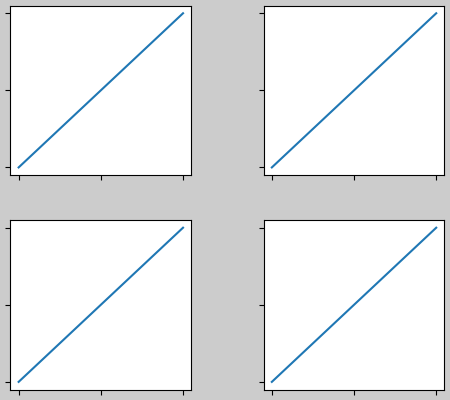
컬러바와의 간격 #
컬러바는 부모로부터 거리 패드 에 배치되며 여기서 패드 는 부모 너비의 일부입니다. 다음 서브플롯까지의 간격은 w/hspace 로 지정됩니다 .
fig, axs = plt.subplots(2, 2, layout="constrained")
pads = [0, 0.05, 0.1, 0.2]
for pad, ax in zip(pads, axs.flat):
    pc = ax.pcolormesh(arr, **pc_kwargs)
    fig.colorbar(pc, ax=ax, shrink=0.6, pad=pad)
    ax.set_xticklabels([])
    ax.set_yticklabels([])
    ax.set_title(f'pad: {pad}')
fig.get_layout_engine().set(w_pad=2 / 72, h_pad=2 / 72, hspace=0.2,
                            wspace=0.2)
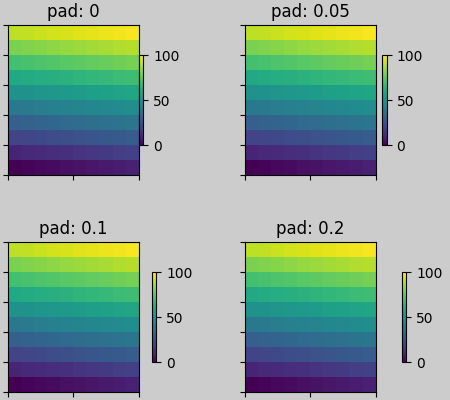
rc파라미터 #
스크립트나 파일에서 설정할 수 있는 5개의 rcParamsmatplotlibrc 가 있습니다
. 그들은 모두 접두사를 가지고 있습니다 figure.constrained_layout:
use : constrained_layout 사용 여부. 기본값은 거짓입니다.
w_pad , h_pad : 축 객체 주변 패딩. 인치를 나타내는 플로트. 기본값은 3./72입니다. 인치(3점)
wspace , hspace : 서브플롯 그룹 사이의 공간. 분리되는 서브플롯 너비의 일부를 나타내는 부동 소수점입니다. 기본값은 0.02입니다.
plt.rcParams['figure.constrained_layout.use'] = True
fig, axs = plt.subplots(2, 2, figsize=(3, 3))
for ax in axs.flat:
    example_plot(ax)
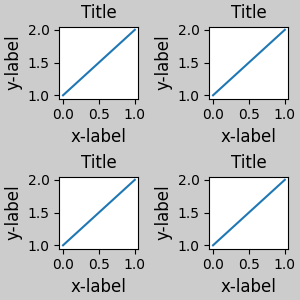
GridSpec # 과 함께 사용
constrained_layout은 , 또는 와 함께 사용하기 subplots()위한
subplot_mosaic()것
GridSpec()입니다
add_subplot().
다음에 나오는 내용에 유의하십시오.layout="constrained"
plt.rcParams['figure.constrained_layout.use'] = False
fig = plt.figure(layout="constrained")

gs1 = gridspec.GridSpec(2, 1, figure=fig)
ax1 = fig.add_subplot(gs1[0])
ax2 = fig.add_subplot(gs1[1])

example_plot(ax1)
example_plot(ax2)
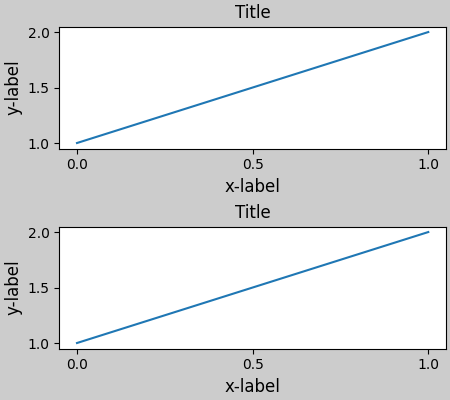
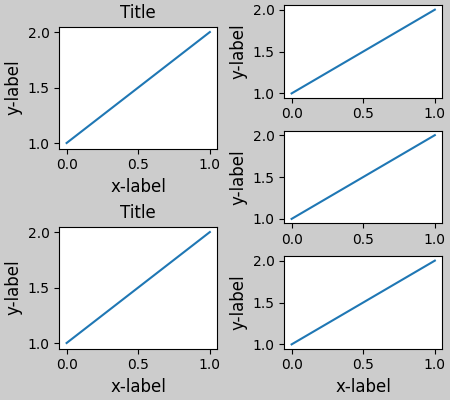
더 복잡한 gridspec 레이아웃이 가능합니다. 여기서 편의 기능 add_gridspec과
를 사용합니다 subgridspec.
fig = plt.figure(layout="constrained")

gs0 = fig.add_gridspec(1, 2)

gs1 = gs0[0].subgridspec(2, 1)
ax1 = fig.add_subplot(gs1[0])
ax2 = fig.add_subplot(gs1[1])

example_plot(ax1)
example_plot(ax2)

gs2 = gs0[1].subgridspec(3, 1)

for ss in gs2:
    ax = fig.add_subplot(ss)
    example_plot(ax)
    ax.set_title("")
    ax.set_xlabel("")

ax.set_xlabel("x-label", fontsize=12)
Text(0.5, 41.33399999999999, 'x-label')
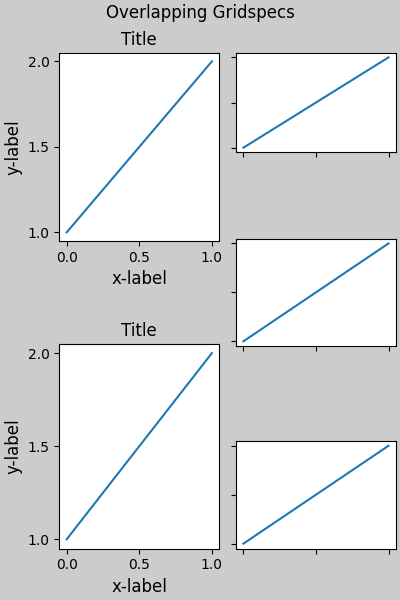
위의 왼쪽 및 오른쪽 열은 동일한 수직 범위를 갖지 않습니다. 두 그리드의 상단과 하단을 정렬하려면 동일한 그리드 사양에 있어야 합니다. 축이 0 높이로 축소되지 않도록 하려면 이 그림도 더 크게 만들어야 합니다.
fig = plt.figure(figsize=(4, 6), layout="constrained")

gs0 = fig.add_gridspec(6, 2)

ax1 = fig.add_subplot(gs0[:3, 0])
ax2 = fig.add_subplot(gs0[3:, 0])

example_plot(ax1)
example_plot(ax2)

ax = fig.add_subplot(gs0[0:2, 1])
example_plot(ax, hide_labels=True)
ax = fig.add_subplot(gs0[2:4, 1])
example_plot(ax, hide_labels=True)
ax = fig.add_subplot(gs0[4:, 1])
example_plot(ax, hide_labels=True)
fig.suptitle('Overlapping Gridspecs')
Text(0.5, 0.993055, 'Overlapping Gridspecs')
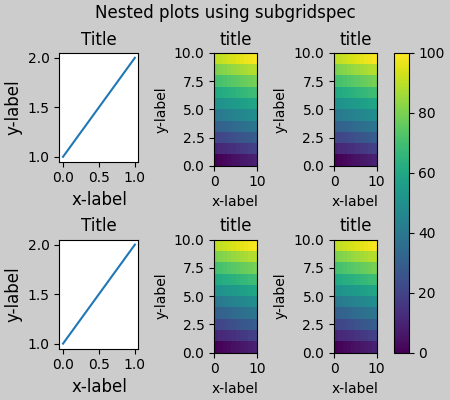
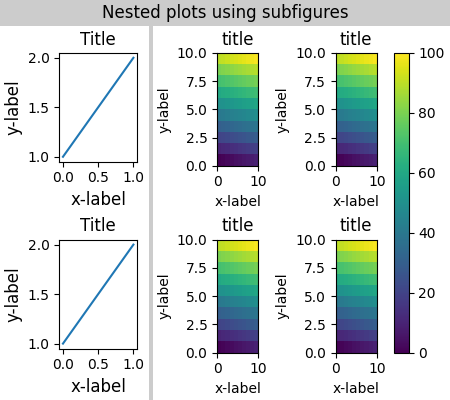
이 예제에서는 두 개의 그리드 사양을 사용하여 컬러바가 하나의 pcolor 세트에만 관련되도록 합니다. 이로 인해 왼쪽 열이 두 개의 오른쪽 열보다 얼마나 넓은지 확인하십시오. 물론 서브플롯의 크기를 동일하게 하려면 하나의 gridspec만 필요합니다. 를 사용하여 동일한 효과를 얻을 수 있습니다 subfigures.
fig = plt.figure(layout="constrained")
gs0 = fig.add_gridspec(1, 2, figure=fig, width_ratios=[1, 2])
gs_left = gs0[0].subgridspec(2, 1)
gs_right = gs0[1].subgridspec(2, 2)

for gs in gs_left:
    ax = fig.add_subplot(gs)
    example_plot(ax)
axs = []
for gs in gs_right:
    ax = fig.add_subplot(gs)
    pcm = ax.pcolormesh(arr, **pc_kwargs)
    ax.set_xlabel('x-label')
    ax.set_ylabel('y-label')
    ax.set_title('title')
    axs += [ax]
fig.suptitle('Nested plots using subgridspec')
fig.colorbar(pcm, ax=axs)
<matplotlib.colorbar.Colorbar object at 0x7f2cdf471c30>
Subgridspec을 사용하는 대신 Matplotlib는 이제 다음 subfigures
과도 작동하는 기능을 제공합니다 constrained_layout.
fig = plt.figure(layout="constrained")
sfigs = fig.subfigures(1, 2, width_ratios=[1, 2])

axs_left = sfigs[0].subplots(2, 1)
for ax in axs_left.flat:
    example_plot(ax)

axs_right = sfigs[1].subplots(2, 2)
for ax in axs_right.flat:
    pcm = ax.pcolormesh(arr, **pc_kwargs)
    ax.set_xlabel('x-label')
    ax.set_ylabel('y-label')
    ax.set_title('title')
fig.colorbar(pcm, ax=axs_right)
fig.suptitle('Nested plots using subfigures')
Text(0.5, 0.9895825, 'Nested plots using subfigures')
축 위치 수동 설정 #
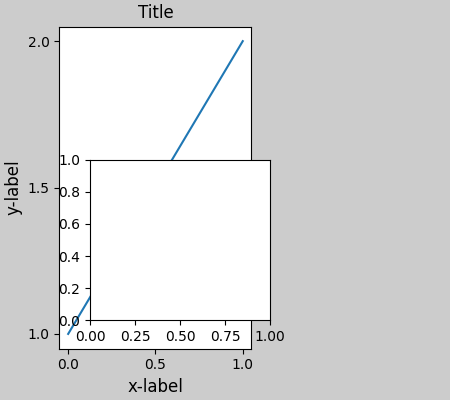
축 위치를 수동으로 설정하는 데는 타당한 이유가 있을 수 있습니다. 에 대한 수동 호출 set_position은 축을 설정하므로 constrained_layout이 더 이상 영향을 미치지 않습니다. ( constrained_layout움직이는 축을 위한 공간은 여전히 남아 있습니다.)
fig, axs = plt.subplots(1, 2, layout="constrained")
example_plot(axs[0], fontsize=12)
axs[1].set_position([0.2, 0.2, 0.4, 0.4])
고정 종횡비 축의 그리드: "압축된" 레이아웃 #
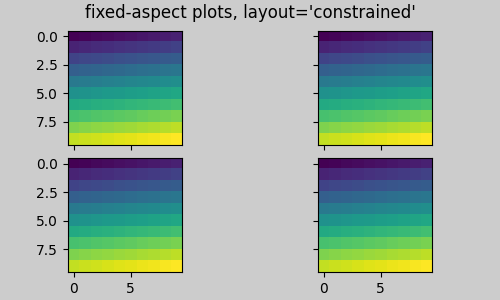
constrained_layout축의 "원래" 위치 그리드에서 작동합니다. 그러나 Axes의 종횡비가 고정된 경우 일반적으로 한쪽이 더 짧아지고 짧아진 방향으로 큰 간격이 남습니다. 다음에서 축은 정사각형이지만 그림이 상당히 넓어 수평 간격이 있습니다.
fig, axs = plt.subplots(2, 2, figsize=(5, 3),
                        sharex=True, sharey=True, layout="constrained")
for ax in axs.flat:
    ax.imshow(arr)
fig.suptitle("fixed-aspect plots, layout='constrained'")
Text(0.5, 0.98611, "fixed-aspect plots, layout='constrained'")
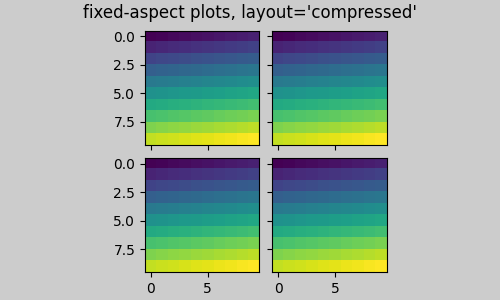
이 문제를 해결하는 한 가지 분명한 방법은 그림 크기를 더 정사각형으로 만드는 것입니다. 그러나 간격을 정확히 좁히려면 시행 착오가 필요합니다. 간단한 Axes 그리드의 layout="compressed"경우 작업을 수행하는 데 사용할 수 있습니다.
fig, axs = plt.subplots(2, 2, figsize=(5, 3),
                        sharex=True, sharey=True, layout='compressed')
for ax in axs.flat:
    ax.imshow(arr)
fig.suptitle("fixed-aspect plots, layout='compressed'")
Text(0.5, 0.98611, "fixed-aspect plots, layout='compressed'")
수동으로 끄기 constrained_layout#
constrained_layout일반적으로 그림의 각 그리기에서 축 위치를 조정합니다. 에서 제공하는 간격을 가져
constrained_layout오지만 업데이트하지 않으려면 초기 그리기를 수행한 다음 를 호출하십시오 fig.set_layout_engine(None). 눈금 레이블의 길이가 변경될 수 있는 애니메이션에 잠재적으로 유용합니다.
도구 모음을 사용하는 백엔드에 대한 GUI 이벤트 및 GUI 이벤트 에 대해 constrained_layout꺼져 있습니다 . 이렇게 하면 확대/축소 및 패닝 중에 축 위치가 변경되지 않습니다.ZOOMPAN
제한 #
호환되지 않는 기능 #
constrained_layout와 함께 작동 pyplot.subplot하지만 각 호출에 대해 행과 열의 수가 동일한 경우에만 가능합니다. 그 이유는 지오메트리가 동일하지 않은 경우 를 호출할 때마다 pyplot.subplot새
GridSpec인스턴스가 생성되고
constrained_layout. 따라서 다음이 잘 작동합니다.
fig = plt.figure(layout="constrained")

ax1 = plt.subplot(2, 2, 1)
ax2 = plt.subplot(2, 2, 3)
# third axes that spans both rows in second column:
ax3 = plt.subplot(2, 2, (2, 4))

example_plot(ax1)
example_plot(ax2)
example_plot(ax3)
plt.suptitle('Homogenous nrows, ncols')
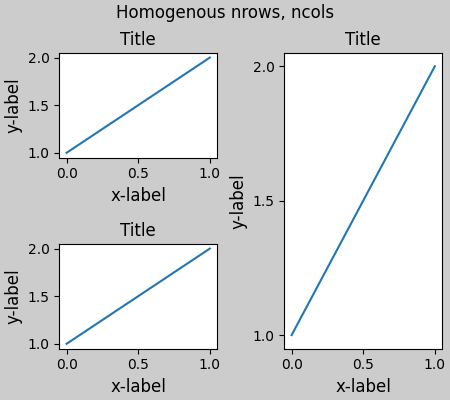
Text(0.5, 0.9895825, 'Homogenous nrows, ncols')
그러나 다음은 잘못된 레이아웃으로 이어집니다.
fig = plt.figure(layout="constrained")

ax1 = plt.subplot(2, 2, 1)
ax2 = plt.subplot(2, 2, 3)
ax3 = plt.subplot(1, 2, 2)

example_plot(ax1)
example_plot(ax2)
example_plot(ax3)
plt.suptitle('Mixed nrows, ncols')
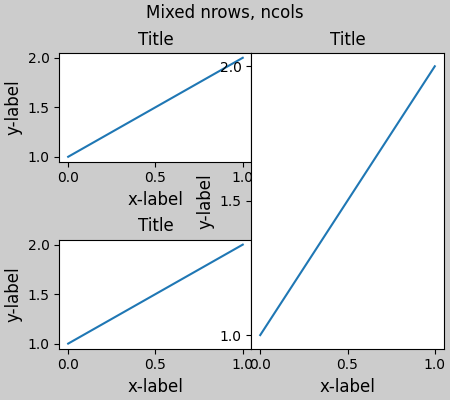
Text(0.5, 0.9895825, 'Mixed nrows, ncols')
유사하게
subplot2gridnrows 및 ncols가 레이아웃이 좋아 보이도록 변경할 수 없다는 동일한 제한으로 작동합니다.
fig = plt.figure(layout="constrained")

ax1 = plt.subplot2grid((3, 3), (0, 0))
ax2 = plt.subplot2grid((3, 3), (0, 1), colspan=2)
ax3 = plt.subplot2grid((3, 3), (1, 0), colspan=2, rowspan=2)
ax4 = plt.subplot2grid((3, 3), (1, 2), rowspan=2)

example_plot(ax1)
example_plot(ax2)
example_plot(ax3)
example_plot(ax4)
fig.suptitle('subplot2grid')
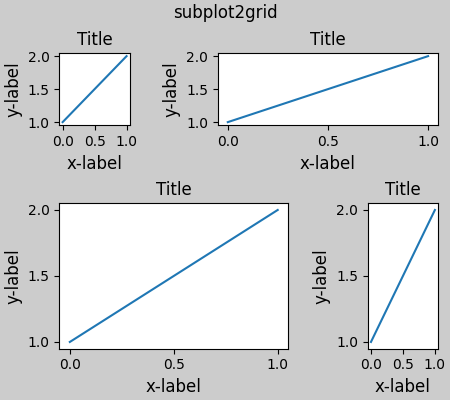
Text(0.5, 0.9895825, 'subplot2grid')
기타 주의 사항 #
constrained_layout눈금 레이블, 축 레이블, 제목 및 범례만 고려합니다. 따라서 다른 아티스트가 잘릴 수도 있고 겹칠 수도 있습니다.눈금 레이블, 축 레이블 및 제목에 필요한 추가 공간은 축의 원래 위치와 무관하다고 가정합니다. 이것은 종종 사실이지만 그렇지 않은 드문 경우가 있습니다.
백엔드가 렌더링 글꼴을 처리하는 방식에는 약간의 차이가 있으므로 결과가 픽셀과 동일하지 않습니다.
축 경계를 넘어 확장되는 축 좌표를 사용하는 아티스트는 축에 추가될 때 비정상적인 레이아웃을 생성합니다.
Figureusing 에 아티스트를 직접 추가하면 이 문제를 피할 수 있습니다add_artist(). 예를 보려면 참조하십시오ConnectionPatch.
디버깅 #
제한된 레이아웃은 예상치 못한 방식으로 실패할 수 있습니다. 제약 조건 솔버를 사용하기 때문에 솔버는 수학적으로 정확하지만 사용자가 원하는 것은 전혀 아닌 솔루션을 찾을 수 있습니다. 일반적인 실패 모드는 모든 크기가 허용 가능한 최소값으로 축소되는 것입니다. 이 경우 다음 두 가지 이유 중 하나입니다.
그리기를 요청한 요소를 위한 공간이 충분하지 않았습니다.
버그가 있습니다. 이 경우 https://github.com/matplotlib/matplotlib/issues 에서 문제를 엽니다 .
버그가 있는 경우 외부 데이터나 종속성(numpy 제외)이 필요하지 않은 자체 포함된 예제와 함께 보고하세요.
알고리즘에 대한 참고 사항 #
제약 조건에 대한 알고리즘은 비교적 간단하지만 그림을 배치할 수 있는 복잡한 방법으로 인해 약간 복잡합니다.
Matplotlib의 레이아웃은 클래스를 통해 gridspec으로 수행됩니다 GridSpec. gridspec은 width_ratios 및 height_ratios 에 의해 설정된 해당 행 및 열에서 Axes의 상대적 너비를 사용하여 그림을 행과 열로 논리적으로 나눈 것 입니다.
constrained_layout에서 각 gridspec은 연결된 layoutgrid 를 가져 옵니다. layoutgrid 에는 각 열에 대한 일련의 left및 변수 와 각 행에 대한 변수가 있으며 더 나아가 왼쪽, 오른쪽, 아래쪽 및 위쪽 각각에 대한 여백이 있습니다. 각 행에서 아래쪽/위쪽 여백은 해당 행의 모든 데코레이터가 수용될 때까지 넓어집니다. 열과 왼쪽/오른쪽 여백도 마찬가지입니다.rightbottomtop
간단한 경우: 하나의 축 #
단일 축의 경우 레이아웃이 간단합니다. 하나의 열과 행으로 구성된 그림에 대한 하나의 부모 layoutgrid와 하나의 행과 열로 구성된 축을 포함하는 gridspec에 대한 자식 layoutgrid가 있습니다. 축의 양쪽에 "장식"을 위한 공간이 만들어집니다. do_constrained_layout()코드에서 이는 다음 과 같은 항목에 의해 수행됩니다
.
gridspec._layoutgrid[0, 0].edit_margin_min('left',
      -bbox.x0 + pos.x0 + w_pad)
여기서 bbox는 축의 타이트한 바운딩 박스와 pos그 위치입니다. 네 개의 여백이 어떻게 축 장식을 둘러싸는지 확인하십시오.
from matplotlib._layoutgrid import plot_children

fig, ax = plt.subplots(layout="constrained")
example_plot(ax, fontsize=24)
plot_children(fig)
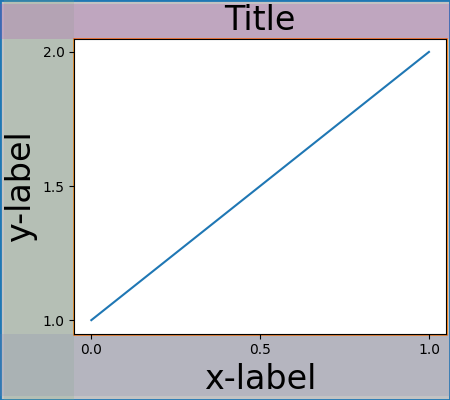
간단한 경우: 두 축 #
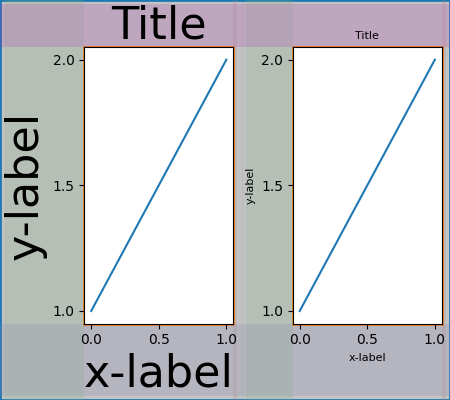
축이 여러 개인 경우 레이아웃이 간단한 방식으로 바인딩됩니다. 이 예에서 왼쪽 축은 오른쪽 축보다 훨씬 더 큰 장식을 가지고 있지만 아래쪽 여백을 공유하므로 더 큰 xlabel을 수용할 수 있을 만큼 크게 만들어집니다. 공유 상단 여백과 동일합니다. 왼쪽 및 오른쪽 여백은 공유되지 않으므로 서로 다를 수 있습니다.
fig, ax = plt.subplots(1, 2, layout="constrained")
example_plot(ax[0], fontsize=32)
example_plot(ax[1], fontsize=8)
plot_children(fig)
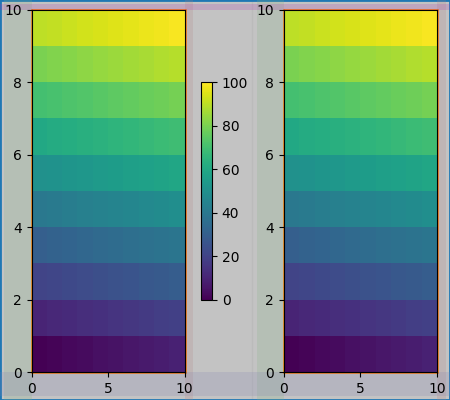
두 개의 축과 컬러바 #
컬러바는 상위 layoutgrid 셀의 여백을 확장하는 또 다른 항목입니다.
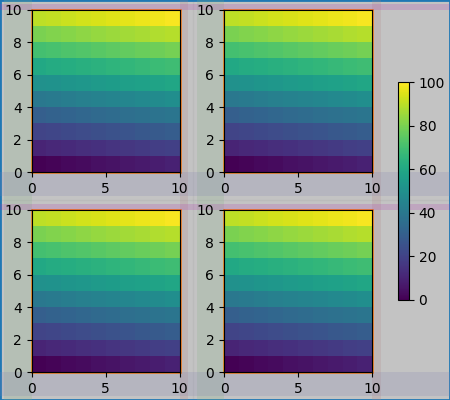
Gridspec # 과 연결된 컬러바
컬러바가 그리드의 둘 이상의 셀에 속하는 경우 각각에 대해 더 큰 여백을 만듭니다.
fig, axs = plt.subplots(2, 2, layout="constrained")
for ax in axs.flat:
    im = ax.pcolormesh(arr, **pc_kwargs)
fig.colorbar(im, ax=axs, shrink=0.6)
plot_children(fig)
고르지 않은 크기의 축 #
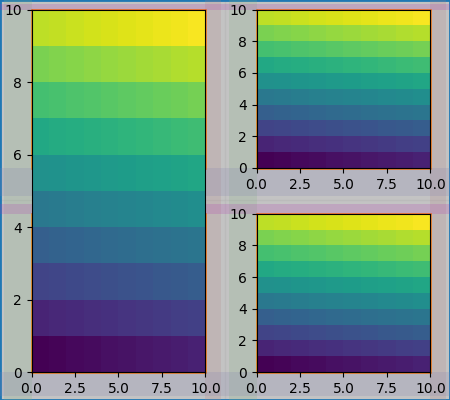
Gridspec 레이아웃에서 축의 크기가 고르지 않게 만드는 두 가지 방법이 있습니다. 하나는 Gridspec 행 또는 열을 가로지르도록 지정하거나 너비와 높이 비율을 지정하는 것입니다.
여기에서는 첫 번째 방법을 사용합니다. 중간 top및
bottom여백은 왼쪽 열의 영향을 받지 않습니다. 이것은 알고리즘의 의식적인 결정이며 두 개의 오른쪽 축 높이가 같지만 왼쪽 축 높이의 1/2이 아닌 경우로 이어집니다. 이는 gridspec제한된 레이아웃 없이 작동하는 방식과 일치합니다.
fig = plt.figure(layout="constrained")
gs = gridspec.GridSpec(2, 2, figure=fig)
ax = fig.add_subplot(gs[:, 0])
im = ax.pcolormesh(arr, **pc_kwargs)
ax = fig.add_subplot(gs[0, 1])
im = ax.pcolormesh(arr, **pc_kwargs)
ax = fig.add_subplot(gs[1, 1])
im = ax.pcolormesh(arr, **pc_kwargs)
plot_children(fig)
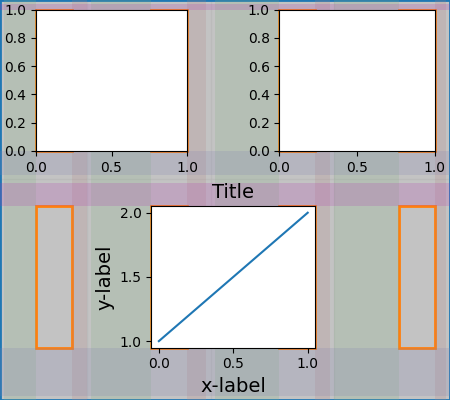
미세 조정이 필요한 한 가지 경우는 여백에 너비를 제한하는 아티스트가 없는 경우입니다. 아래의 경우 0열의 오른쪽 여백과 3열의 왼쪽 여백에는 너비를 설정할 여백 아티스트가 없으므로 아티스트가 있는 여백 너비의 최대 너비를 사용합니다. 이렇게 하면 모든 축의 크기가 동일해집니다.
fig = plt.figure(layout="constrained")
gs = fig.add_gridspec(2, 4)
ax00 = fig.add_subplot(gs[0, 0:2])
ax01 = fig.add_subplot(gs[0, 2:])
ax10 = fig.add_subplot(gs[1, 1:3])
example_plot(ax10, fontsize=14)
plot_children(fig)
plt.show()
스크립트의 총 실행 시간: ( 0분 18.885초)