메모
전체 예제 코드를 다운로드 하려면 여기 를 클릭 하십시오.
복잡하고 의미 있는 도형 구성 #
경고
이 튜토리얼은 실험적/임시 API를 문서화합니다. 사용자 피드백을 받기 위해 v3.3에서 릴리스합니다. 향후 버전에서는 경고 없이 주요 변경 사항을 적용할 수 있습니다.
균일하지 않은 그리드에 그림의 축을 배치하는 것은 지루하고 장황할 수 있습니다. 조밀하고 균일한 그리드 Figure.subplots의 경우 레이아웃의 여러 열/행에 걸쳐 있거나 그림의 일부 영역을 비워두는 축과 같은 더 복잡한 레이아웃의 경우 사용하거나
( 그림에서 여러 축 정렬gridspec.GridSpec 참조 ) 수동으로 배치할 수 있습니다. 축. 이 프로세스를 간소화하기 위해 (ASCII 아트 또는 중첩 목록으로) 축을 시각적으로 배치하는 인터페이스를 제공하는 것을 목표로 합니다.Figure.subplot_mosaic
이 인터페이스는 자연스럽게 축 이름 지정을 지원합니다.
Figure.subplot_mosaic그림을 배치하는 데 사용된 레이블에 키가 있는 사전을 반환합니다. 이름이 있는 데이터 구조를 반환하면 Figure 레이아웃과 독립적인 플로팅 코드를 작성하기가 더 쉽습니다.
이는 제안된 MEP 및 R용 패치워크 라이브러리에서 영감을 받았습니다. 연산자 오버로딩 스타일을 구현하지는 않지만 (중첩된) Axes 레이아웃을 지정하기 위한 Pythonic API를 제공합니다.
import matplotlib.pyplot as plt
import numpy as np


# Helper function used for visualization in the following examples
def identify_axes(ax_dict, fontsize=48):
    """
    Helper to identify the Axes in the examples below.

    Draws the label in a large font in the center of the Axes.

    Parameters
    ----------
    ax_dict : dict[str, Axes]
        Mapping between the title / label and the Axes.
    fontsize : int, optional
        How big the label should be.
    """
    kw = dict(ha="center", va="center", fontsize=fontsize, color="darkgrey")
    for k, ax in ax_dict.items():
        ax.text(0.5, 0.5, k, transform=ax.transAxes, **kw)
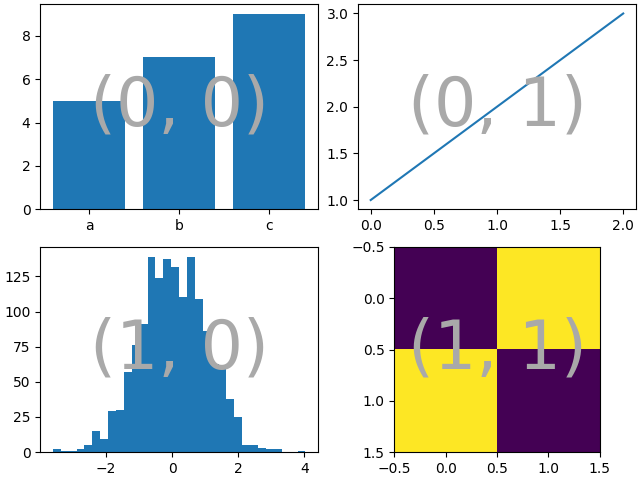
2x2 그리드가 필요한 경우 플로팅을 수행하기 위해 인덱싱할 수 Figure.subplots있는 2D 배열을 반환하는 which 를 사용할 수 있습니다.axes.Axes
np.random.seed(19680801)
hist_data = np.random.randn(1_500)


fig = plt.figure(constrained_layout=True)
ax_array = fig.subplots(2, 2, squeeze=False)

ax_array[0, 0].bar(["a", "b", "c"], [5, 7, 9])
ax_array[0, 1].plot([1, 2, 3])
ax_array[1, 0].hist(hist_data, bins="auto")
ax_array[1, 1].imshow([[1, 2], [2, 1]])

identify_axes(
    {(j, k): a for j, r in enumerate(ax_array) for k, a in enumerate(r)},
)
를 사용 Figure.subplot_mosaic하면 동일한 모자이크를 생성할 수 있지만 축에 의미론적 이름을 부여할 수 있습니다.
fig = plt.figure(constrained_layout=True)
ax_dict = fig.subplot_mosaic(
    [
        ["bar", "plot"],
        ["hist", "image"],
    ],
)
ax_dict["bar"].bar(["a", "b", "c"], [5, 7, 9])
ax_dict["plot"].plot([1, 2, 3])
ax_dict["hist"].hist(hist_data)
ax_dict["image"].imshow([[1, 2], [2, 1]])
identify_axes(ax_dict)
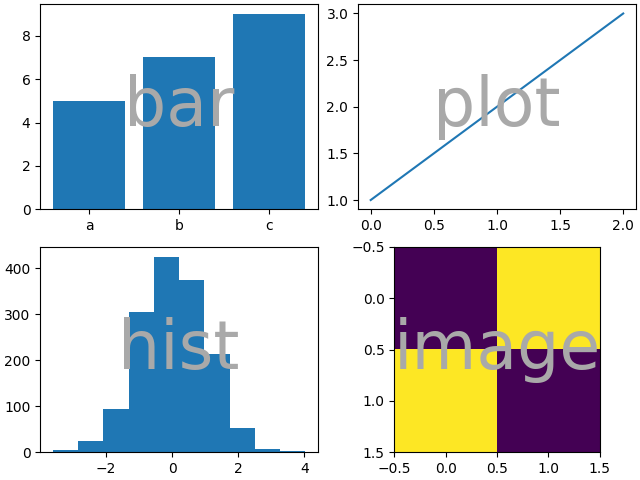
Figure.subplots와
사이의 주요 차이점 Figure.subplot_mosaic은 반환 값입니다. 전자는 인덱스 액세스를 위한 배열을 반환하지만 후자는 레이블을 axes.Axes생성된 인스턴스 에 매핑하는 사전을 반환합니다.
print(ax_dict)
{'bar': <AxesSubplot: label='bar'>, 'plot': <AxesSubplot: label='plot'>, 'hist': <AxesSubplot: label='hist'>, 'image': <AxesSubplot: label='image'>}
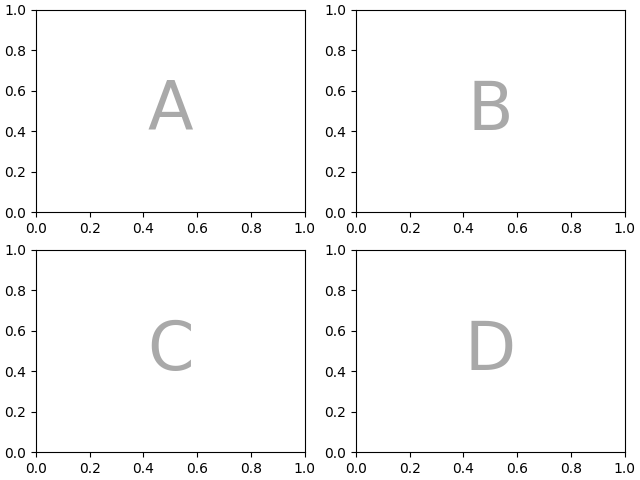
문자열 속기 #
축 레이블을 단일 문자로 제한하여 "ASCII 아트"로 원하는 축을 "그릴" 수 있습니다. 다음과 같은
mosaic = """
    AB
    CD
    """
2x2 그리드에 배치된 4개의 축을 제공하고 위와 동일한 그림 모자이크를 생성합니다(그러나 이제는 가 아닌 레이블이 지정됨 ).{"A", "B", "C",
"D"}{"bar", "plot", "hist", "image"}
fig = plt.figure(constrained_layout=True)
ax_dict = fig.subplot_mosaic(mosaic)
identify_axes(ax_dict)

또는 더 간결한 문자열 표기법을 사용할 수 있습니다.
mosaic = "AB;CD"
";"줄 바꿈 대신 행 구분 기호로 사용되는 동일한 구성을 제공합니다 .
fig = plt.figure(constrained_layout=True)
ax_dict = fig.subplot_mosaic(mosaic)
identify_axes(ax_dict)
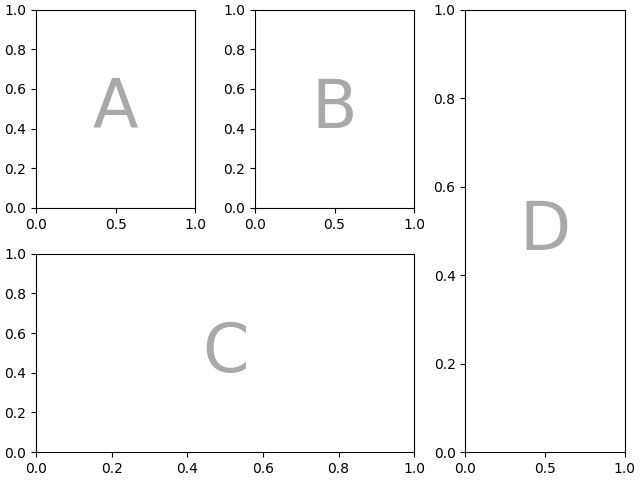
여러 행/열에 걸친 축 #
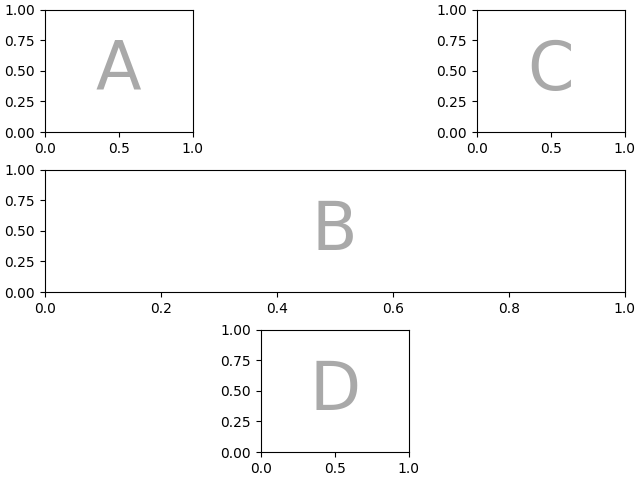
우리가 할 수 있는 Figure.subplot_mosaic것은 Figure.subplotsAxes가 여러 행이나 열에 걸쳐 있어야 한다고 지정하는 것입니다.
4개의 Axes를 재배치 "C"하여 하단에 수평 범위가 "D"있고 오른쪽에 수직 범위가 되도록 하려면 다음을 수행합니다.
axd = plt.figure(constrained_layout=True).subplot_mosaic(
    """
    ABD
    CCD
    """
)
identify_axes(axd)
축이 있는 그림의 모든 공간을 채우지 않으려면 그리드의 일부 공간을 공백으로 지정할 수 있습니다.
axd = plt.figure(constrained_layout=True).subplot_mosaic(
    """
    A.C
    BBB
    .D.
    """
)
identify_axes(axd)
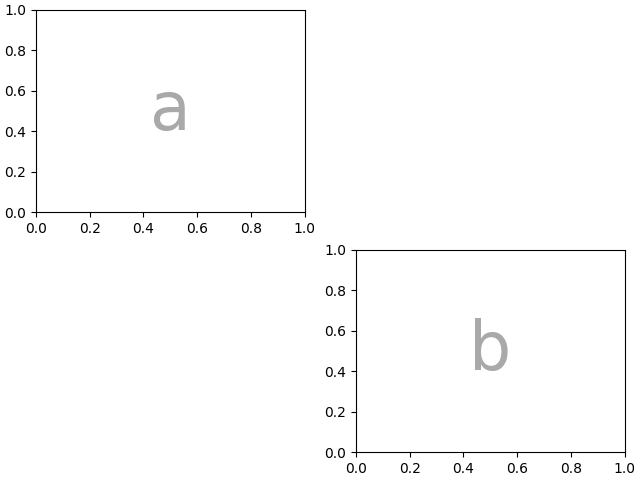
"."빈 공간을 표시하기 위해 마침표 대신 다른 문자를 사용하려면 empty_sentinel 을 사용하여 사용할 문자를 지정할 수 있습니다.
axd = plt.figure(constrained_layout=True).subplot_mosaic(
    """
    aX
    Xb
    """,
    empty_sentinel="X",
)
identify_axes(axd)
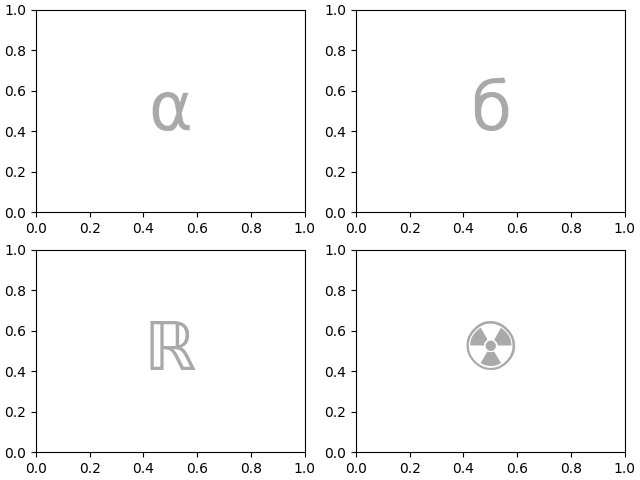
내부적으로 우리가 사용하는 문자에 첨부된 의미가 없으며 모든 유니코드 코드 포인트가 유효합니다!
axd = plt.figure(constrained_layout=True).subplot_mosaic(
    """αб
       ℝ☢"""
)
identify_axes(axd)
입력을 처리하는 동안 공백이 제거될 수 있으므로 공백을 약식 문자열이 있는 레이블 또는 빈 센티넬로 사용하는 것은 권장되지 않습니다.
모자이크 및 서브플롯 생성 제어 #
이 기능은 위에 구축되었으며 gridspec키워드 인수를 기본으로 전달할 수 있습니다 gridspec.GridSpec
( 와 동일 Figure.subplots).
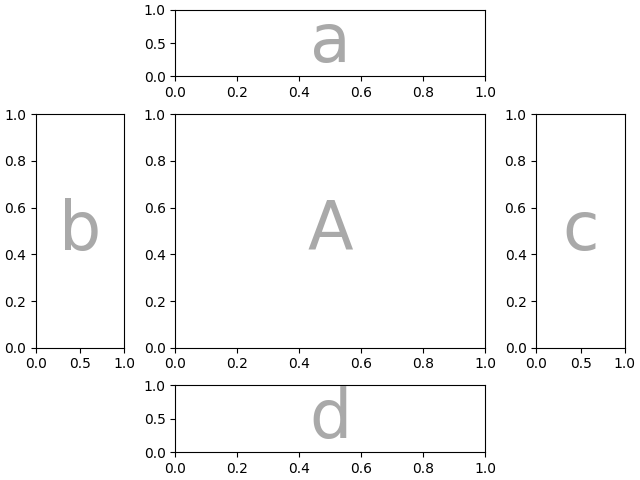
이 경우 입력을 사용하여 배열을 지정하지만 gridspec_kw 를 통해 행/열의 상대적 너비를 설정합니다 .
axd = plt.figure(constrained_layout=True).subplot_mosaic(
    """
    .a.
    bAc
    .d.
    """,
    # set the height ratios between the rows
    height_ratios=[1, 3.5, 1],
    # set the width ratios between the columns
    width_ratios=[1, 3.5, 1],
)
identify_axes(axd)
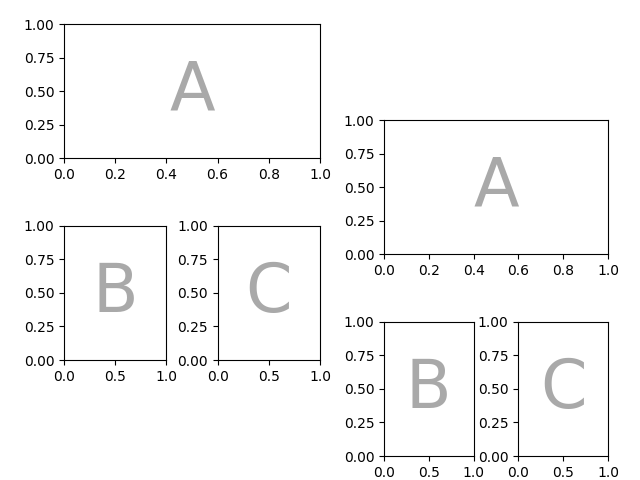
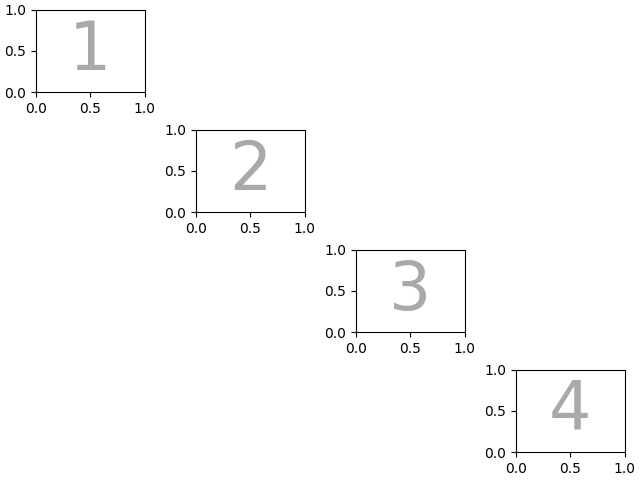
또는 { left , right , bottom , top } 키워드 인수를 사용하여 전체 모자이크의 위치를 지정하여 동일한 모자이크의 여러 버전을 그림에 넣습니다.
mosaic = """AA
            BC"""
fig = plt.figure()
axd = fig.subplot_mosaic(
    mosaic,
    gridspec_kw={
        "bottom": 0.25,
        "top": 0.95,
        "left": 0.1,
        "right": 0.5,
        "wspace": 0.5,
        "hspace": 0.5,
    },
)
identify_axes(axd)

axd = fig.subplot_mosaic(
    mosaic,
    gridspec_kw={
        "bottom": 0.05,
        "top": 0.75,
        "left": 0.6,
        "right": 0.95,
        "wspace": 0.5,
        "hspace": 0.5,
    },
)
identify_axes(axd)
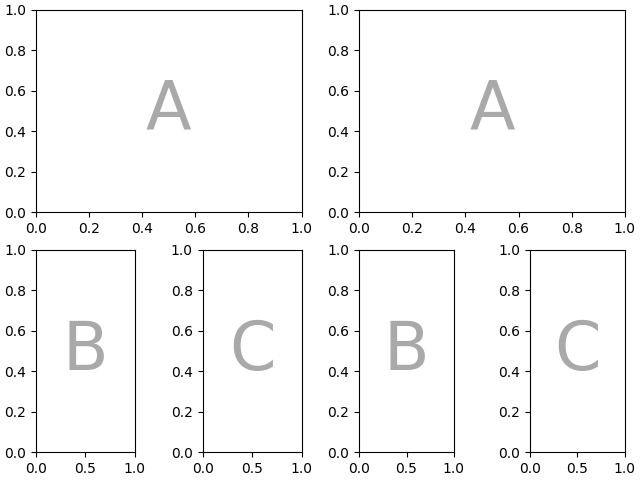
또는 하위 그림 기능을 사용할 수 있습니다.
mosaic = """AA
            BC"""
fig = plt.figure(constrained_layout=True)
left, right = fig.subfigures(nrows=1, ncols=2)
axd = left.subplot_mosaic(mosaic)
identify_axes(axd)

axd = right.subplot_mosaic(mosaic)
identify_axes(axd)
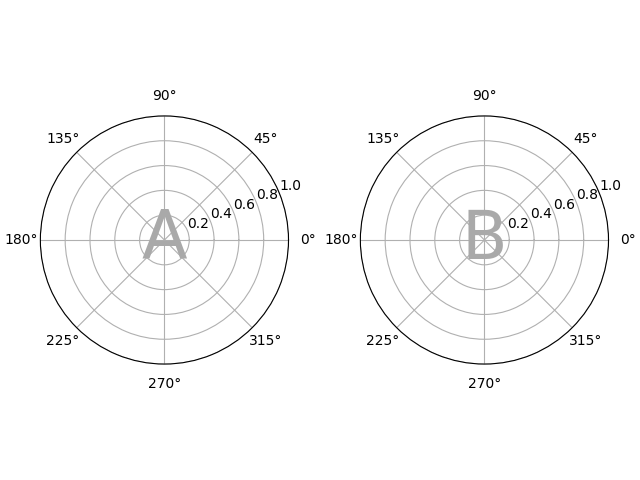
또한 서브플롯을 생성하는 데 사용되는 인수를 전달할 수도 있습니다(다시 말하지만 와 동일 Figure.subplots).
axd = plt.figure(constrained_layout=True).subplot_mosaic(
    "AB", subplot_kw={"projection": "polar"}
)
identify_axes(axd)
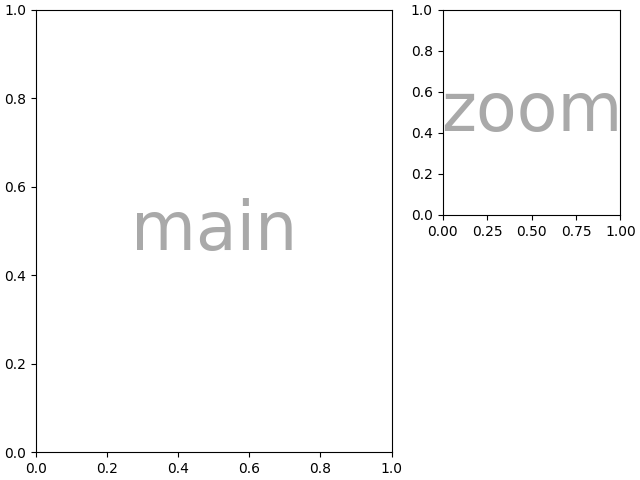
중첩 목록 입력 #
단축형 문자열로 할 수 있는 모든 작업은 목록을 전달할 때도 수행할 수 있습니다(내부적으로 단축형 문자열을 중첩된 목록으로 변환). 예를 들어 spans, 공백 및 gridspec_kw 를 사용합니다 .
axd = plt.figure(constrained_layout=True).subplot_mosaic(
    [
        ["main", "zoom"],
        ["main", "BLANK"],
    ],
    empty_sentinel="BLANK",
    width_ratios=[2, 1],
)
identify_axes(axd)
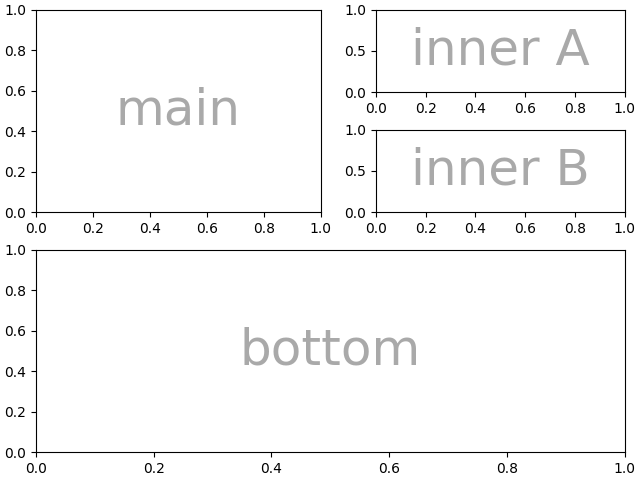
또한 목록 입력을 사용하여 중첩된 모자이크를 지정할 수 있습니다. 내부 목록의 모든 요소는 또 다른 중첩 목록 집합이 될 수 있습니다.
inner = [
    ["inner A"],
    ["inner B"],
]

outer_nested_mosaic = [
    ["main", inner],
    ["bottom", "bottom"],
]
axd = plt.figure(constrained_layout=True).subplot_mosaic(
    outer_nested_mosaic, empty_sentinel=None
)
identify_axes(axd, fontsize=36)
또한 2D NumPy 배열을 전달하여 다음과 같은 작업을 수행할 수 있습니다.
스크립트의 총 실행 시간: (0분 9.170초)