메모
전체 예제 코드를 다운로드 하려면 여기 를 클릭 하십시오.
# 의 원점 과 범위imshow
imshow()데이터 공간의 사각형 영역에 이미지(색상 매핑되는 2D 배열( norm 및 cmap 기반 ) 또는 있는 그대로 사용되는 3D RGB(A) 배열)를 렌더링할 수 있습니다. 최종 렌더링에서 이미지의 방향은 origin 및 extent
키워드 인수(및 결과 AxesImage인스턴스의 특성)와 축의 데이터 제한에 의해 제어됩니다.
extent 키워드 인수 는 데이터 좌표 로 지정된 이미지가 채울 데이터 좌표의 경계 상자를 제어 하고 origin 키워드 인수는 이미지가 해당 경계 상자를 채우는 방식을 제어하며 최종 렌더링된 이미지의 방향도 축 제한의 영향을 받습니다. .(left, right, bottom, top)
힌트
아래 코드의 대부분은 플롯에 레이블 및 정보 텍스트를 추가하는 데 사용됩니다. 설명된 기원 및 범위 의 효과는 모든 코드 세부 사항을 따를 필요 없이 플롯에서 볼 수 있습니다.
빠른 이해를 위해 아래 코드 세부 정보를 건너뛰고 바로 결과에 대한 논의를 계속할 수 있습니다.
import numpy as np
import matplotlib.pyplot as plt
from matplotlib.gridspec import GridSpec


def index_to_coordinate(index, extent, origin):
    """Return the pixel center of an index."""
    left, right, bottom, top = extent

    hshift = 0.5 * np.sign(right - left)
    left, right = left + hshift, right - hshift
    vshift = 0.5 * np.sign(top - bottom)
    bottom, top = bottom + vshift, top - vshift

    if origin == 'upper':
        bottom, top = top, bottom

    return {
        "[0, 0]": (left, bottom),
        "[M', 0]": (left, top),
        "[0, N']": (right, bottom),
        "[M', N']": (right, top),
    }[index]


def get_index_label_pos(index, extent, origin, inverted_xindex):
    """
    Return the desired position and horizontal alignment of an index label.
    """
    if extent is None:
        extent = lookup_extent(origin)
    left, right, bottom, top = extent
    x, y = index_to_coordinate(index, extent, origin)

    is_x0 = index[-2:] == "0]"
    halign = 'left' if is_x0 ^ inverted_xindex else 'right'
    hshift = 0.5 * np.sign(left - right)
    x += hshift * (1 if is_x0 else -1)
    return x, y, halign


def get_color(index, data, cmap):
    """Return the data color of an index."""
    val = {
        "[0, 0]": data[0, 0],
        "[0, N']": data[0, -1],
        "[M', 0]": data[-1, 0],
        "[M', N']": data[-1, -1],
    }[index]
    return cmap(val / data.max())


def lookup_extent(origin):
    """Return extent for label positioning when not given explicitly."""
    if origin == 'lower':
        return (-0.5, 6.5, -0.5, 5.5)
    else:
        return (-0.5, 6.5, 5.5, -0.5)


def set_extent_None_text(ax):
    ax.text(3, 2.5, 'equals\nextent=None', size='large',
            ha='center', va='center', color='w')


def plot_imshow_with_labels(ax, data, extent, origin, xlim, ylim):
    """Actually run ``imshow()`` and add extent and index labels."""
    im = ax.imshow(data, origin=origin, extent=extent)

    # extent labels (left, right, bottom, top)
    left, right, bottom, top = im.get_extent()
    if xlim is None or top > bottom:
        upper_string, lower_string = 'top', 'bottom'
    else:
        upper_string, lower_string = 'bottom', 'top'
    if ylim is None or left < right:
        port_string, starboard_string = 'left', 'right'
        inverted_xindex = False
    else:
        port_string, starboard_string = 'right', 'left'
        inverted_xindex = True
    bbox_kwargs = {'fc': 'w', 'alpha': .75, 'boxstyle': "round4"}
    ann_kwargs = {'xycoords': 'axes fraction',
                  'textcoords': 'offset points',
                  'bbox': bbox_kwargs}
    ax.annotate(upper_string, xy=(.5, 1), xytext=(0, -1),
                ha='center', va='top', **ann_kwargs)
    ax.annotate(lower_string, xy=(.5, 0), xytext=(0, 1),
                ha='center', va='bottom', **ann_kwargs)
    ax.annotate(port_string, xy=(0, .5), xytext=(1, 0),
                ha='left', va='center', rotation=90,
                **ann_kwargs)
    ax.annotate(starboard_string, xy=(1, .5), xytext=(-1, 0),
                ha='right', va='center', rotation=-90,
                **ann_kwargs)
    ax.set_title('origin: {origin}'.format(origin=origin))

    # index labels
    for index in ["[0, 0]", "[0, N']", "[M', 0]", "[M', N']"]:
        tx, ty, halign = get_index_label_pos(index, extent, origin,
                                             inverted_xindex)
        facecolor = get_color(index, data, im.get_cmap())
        ax.text(tx, ty, index, color='white', ha=halign, va='center',
                bbox={'boxstyle': 'square', 'facecolor': facecolor})
    if xlim:
        ax.set_xlim(*xlim)
    if ylim:
        ax.set_ylim(*ylim)


def generate_imshow_demo_grid(extents, xlim=None, ylim=None):
    N = len(extents)
    fig = plt.figure(tight_layout=True)
    fig.set_size_inches(6, N * (11.25) / 5)
    gs = GridSpec(N, 5, figure=fig)

    columns = {'label': [fig.add_subplot(gs[j, 0]) for j in range(N)],
               'upper': [fig.add_subplot(gs[j, 1:3]) for j in range(N)],
               'lower': [fig.add_subplot(gs[j, 3:5]) for j in range(N)]}
    x, y = np.ogrid[0:6, 0:7]
    data = x + y

    for origin in ['upper', 'lower']:
        for ax, extent in zip(columns[origin], extents):
            plot_imshow_with_labels(ax, data, extent, origin, xlim, ylim)

    columns['label'][0].set_title('extent=')
    for ax, extent in zip(columns['label'], extents):
        if extent is None:
            text = 'None'
        else:
            left, right, bottom, top = extent
            text = (f'left: {left:0.1f}\nright: {right:0.1f}\n'
                    f'bottom: {bottom:0.1f}\ntop: {top:0.1f}\n')
        ax.text(1., .5, text, transform=ax.transAxes, ha='right', va='center')
        ax.axis('off')
    return columns
기본 범위 #
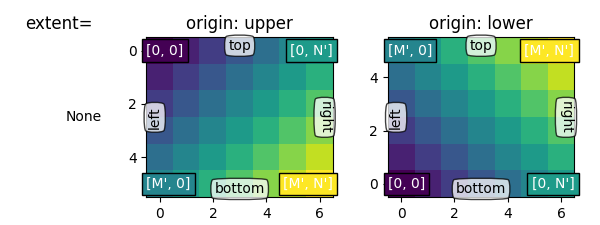
먼저 기본 설정을 살펴보겠습니다.extent=None
generate_imshow_demo_grid(extents=[None])

{'label': [<AxesSubplot: title={'center': 'extent='}>], 'upper': [<AxesSubplot: title={'center': 'origin: upper'}>], 'lower': [<AxesSubplot: title={'center': 'origin: lower'}>]}
일반적으로 모양이 (M, N)인 배열의 경우 첫 번째 인덱스는 세로를 따라 실행되고 두 번째 인덱스는 가로를 따라 실행됩니다.
픽셀 중심은 0에서 수평으로, 0에서 수직으로 범위의 정수 위치에 있습니다 .
origin 은 데이터가 경계 상자에 채워지는 방식을 결정합니다.N' = N - 1M' = M - 1
대상 origin='lower':
[0, 0]은 (왼쪽, 아래쪽)에 있습니다.
[M', 0]은 (왼쪽, 위)에 있습니다.
[0, N']은 (오른쪽, 아래쪽)에 있습니다.
[M', N']은 (오른쪽, 상단)에 있습니다.
origin='upper'세로축 방향과 채우기를 반대로 바꿉니다.
[0, 0]은 (왼쪽, 위쪽)에 있습니다.
[M', 0]은 (왼쪽, 아래쪽)에 있습니다.
[0, N']은 (오른쪽, 상단)에 있습니다.
[M', N']은 (오른쪽, 아래)에 있습니다.
요약하면 [0, 0] 인덱스의 위치와 범위는 origin 의 영향을 받습니다 .
기원 |
[0, 0] 위치 |
정도 |
|---|---|---|
높은 |
왼쪽 위 |
|
낮추다 |
왼쪽 하단 |
|
origin 의 기본값 은 rcParams["image.origin"](기본값: 'upper') 으로 설정되며 기본적 'upper'으로 수학 및 컴퓨터 그래픽 이미지 인덱싱 규칙의 매트릭스 인덱싱 규칙과 일치합니다.
명시적 범위 #
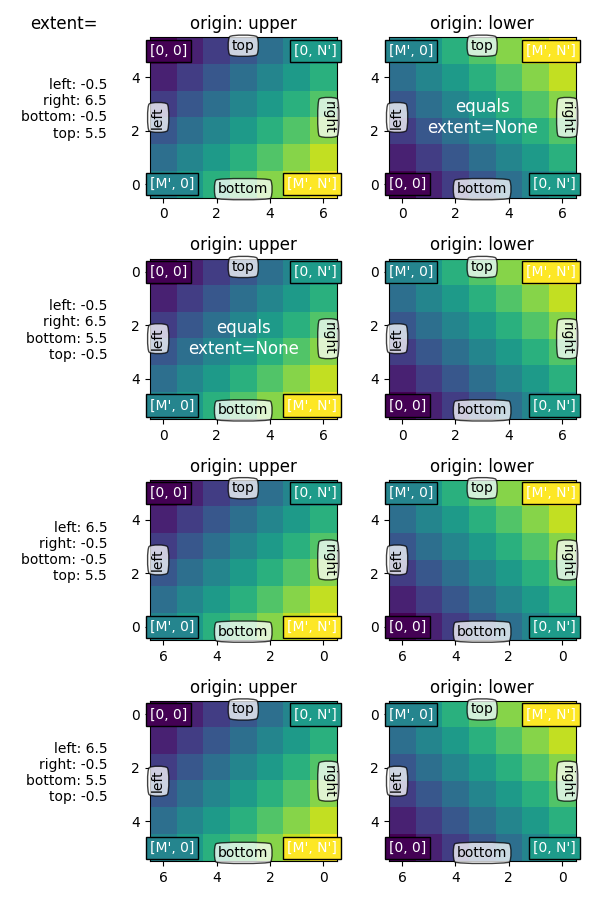
범위 를 설정 하여 이미지 영역의 좌표를 정의합니다. 기본 이미지 데이터는 해당 영역을 채우기 위해 보간/리샘플링됩니다.
축이 자동 크기 조정 으로 설정된 경우 축의 보기 제한은 에서 설정한 좌표
가 축의 왼쪽 하단에 있도록 하는 범위 와 일치하도록 설정됩니다! 그러나 이렇게 하면 축이 반전되어 '자연스러운' 방향으로 증가하지 않을 수 있습니다.(left, bottom)

명시적 범위 및 축 제한 #
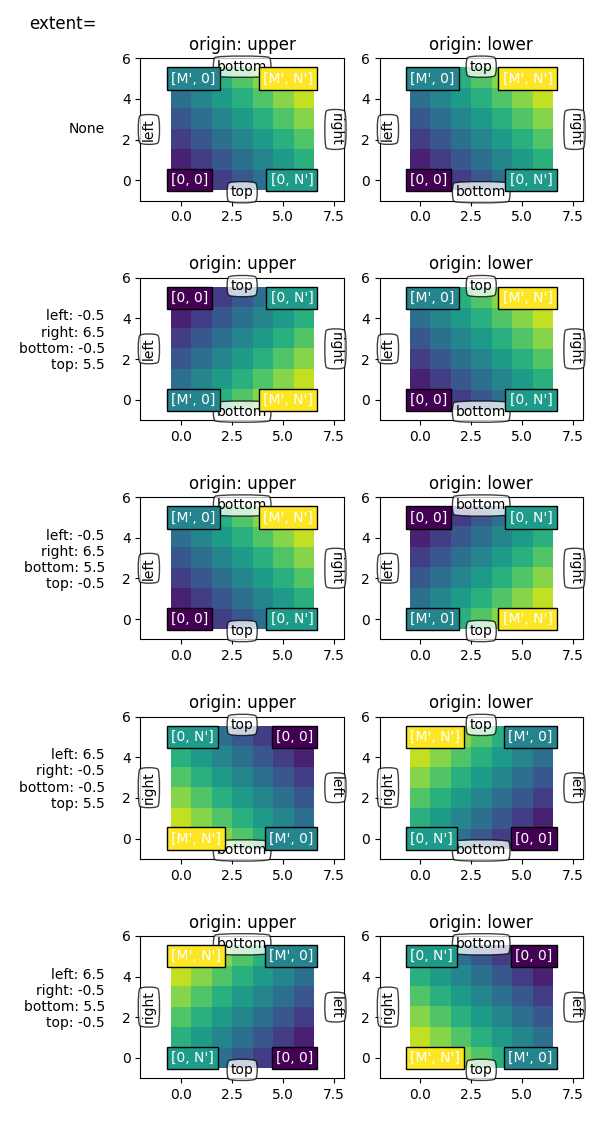
set_xlim명시적으로 /
를 설정하여 축 제한을 고정하면 축의 set_ylim특정 크기와 방향을 강제합니다. 이렇게 하면 화면의 방향에서 이미지의 '좌우' 및 '상하' 감각을 분리할 수 있습니다.
아래 예에서는 범위보다 약간 더 큰 제한을 선택했습니다(축 내의 흰색 영역 참고).
이전 예제에서와 같이 범위를 유지하는 동안 좌표(0, 0)는 이제 명시적으로 왼쪽 하단에 배치되고 값은 위쪽과 오른쪽으로(관람자의 관점에서) 증가합니다. 우리는 다음을 볼 수 있습니다.
좌표 는 데이터 공간 의 지점을 향해 가는 상자를 채우는 이미지를 고정합니다 .
(left, bottom)(right, top)첫 번째 열은 항상 '왼쪽'에 가장 가깝습니다.
origin 은 첫 번째 행이 '상단' 또는 '하단'에 가장 가까운지를 제어합니다.
이미지는 어느 방향으로든 반전될 수 있습니다.
이미지의 '좌우' 및 '상하' 감각은 화면 방향과 분리될 수 있습니다.

스크립트의 총 실행 시간: (0분 4.816초)