메모
전체 예제 코드를 다운로드 하려면 여기 를 클릭 하십시오.
Matplotlib 플롯의 텍스트 #
Matplotlib의 텍스트 플로팅 및 작업 소개.
Matplotlib는 수학적 표현 지원, 래스터 및 벡터 출력에 대한 트루타입 지원, 임의 회전으로 줄 바꿈으로 구분된 텍스트, 유니코드 지원을 포함하여 광범위한 텍스트 지원을 제공합니다.
출력 문서(예: 포스트스크립트 또는 PDF)에 글꼴을 직접 포함하기 때문에 화면에 표시되는 내용이 하드카피로 표시됩니다.
FreeType 지원은 작은 래스터 크기에서도 잘 보이는 매우 멋진 앤티앨리어싱된 글꼴을 생성합니다. Matplotlib에는 크로스 플랫폼, W3C
호환 글꼴 찾기 알고리즘 을 구현하는 자체
matplotlib.font_manager(Paul Barrett 덕분에)가 포함되어 있습니다.
사용자는 rc 파일 에 설정된 합리적인 기본값을 사용하여 텍스트 속성(글꼴 크기, 글꼴 두께, 텍스트 위치 및 색상 등)에 대해 많은 제어 권한을 가집니다 . 그리고 중요한 점은 수학적 또는 과학적 수치에 관심이 있는 사람들을 위해 Matplotlib는 많은 수의 TeX 수학 기호 및 명령을 구현 하여 그림의 모든 위치에서 수학적 표현 을 지원 합니다.
기본 텍스트 명령어 #
다음 명령은 암시적 및 명시적 인터페이스에서 텍스트를 생성하는 데 사용됩니다( 장단점에 대한 설명 은 Matplotlib 애플리케이션 인터페이스(API) 참조).
암시적 API |
명시적 API |
설명 |
|---|---|---|
의 임의의 위치에 텍스트를 추가합니다 |
||
선택적 화살표가 있는 주석을 의 임의 위치에 추가합니다
|
||
|
||
|
||
에 제목을 추가합니다
|
||
의 임의의 위치에 텍스트를 추가합니다 |
||
에 제목을 추가합니다 |
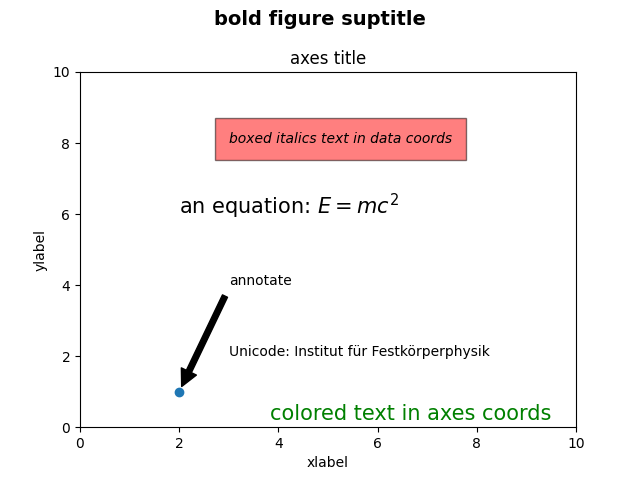
Text이러한 모든 함수 는 다양한 글꼴 및 기타 속성으로 구성할 수 있는 인스턴스를 만들고 반환 합니다. 아래 예는 이러한 명령이 모두 작동하는 것을 보여 주며 자세한 내용은 다음 섹션에서 제공됩니다.
import matplotlib
import matplotlib.pyplot as plt

fig = plt.figure()
ax = fig.add_subplot()
fig.subplots_adjust(top=0.85)

# Set titles for the figure and the subplot respectively
fig.suptitle('bold figure suptitle', fontsize=14, fontweight='bold')
ax.set_title('axes title')

ax.set_xlabel('xlabel')
ax.set_ylabel('ylabel')

# Set both x- and y-axis limits to [0, 10] instead of default [0, 1]
ax.axis([0, 10, 0, 10])

ax.text(3, 8, 'boxed italics text in data coords', style='italic',
        bbox={'facecolor': 'red', 'alpha': 0.5, 'pad': 10})

ax.text(2, 6, r'an equation: $E=mc^2$', fontsize=15)

ax.text(3, 2, 'Unicode: Institut für Festkörperphysik')

ax.text(0.95, 0.01, 'colored text in axes coords',
        verticalalignment='bottom', horizontalalignment='right',
        transform=ax.transAxes,
        color='green', fontsize=15)

ax.plot([2], [1], 'o')
ax.annotate('annotate', xy=(2, 1), xytext=(3, 4),
            arrowprops=dict(facecolor='black', shrink=0.05))

plt.show()
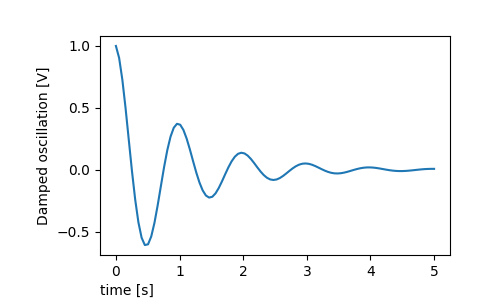
x축 및 y축 레이블 #
set_xlabelx축 및 y축에 대한 레이블을 지정하는 것은 및 set_ylabel
메서드 를 통해 간단
합니다.
import matplotlib.pyplot as plt
import numpy as np

x1 = np.linspace(0.0, 5.0, 100)
y1 = np.cos(2 * np.pi * x1) * np.exp(-x1)

fig, ax = plt.subplots(figsize=(5, 3))
fig.subplots_adjust(bottom=0.15, left=0.2)
ax.plot(x1, y1)
ax.set_xlabel('time [s]')
ax.set_ylabel('Damped oscillation [V]')

plt.show()
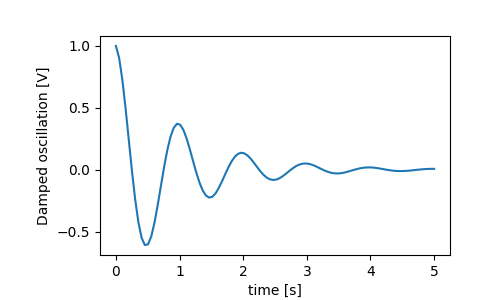
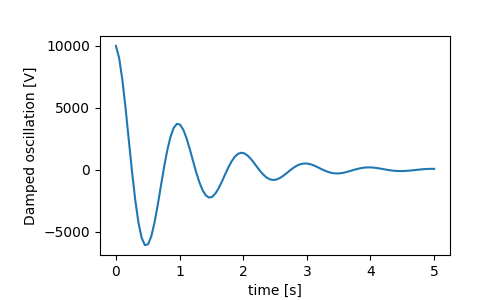
x 및 y 레이블은 x 및 y 눈금 레이블을 지우도록 자동으로 배치됩니다. 아래 그림을 위 그림과 비교하고 y 레이블이 위 그림의 왼쪽에 있음을 확인하십시오.
fig, ax = plt.subplots(figsize=(5, 3))
fig.subplots_adjust(bottom=0.15, left=0.2)
ax.plot(x1, y1*10000)
ax.set_xlabel('time [s]')
ax.set_ylabel('Damped oscillation [V]')

plt.show()
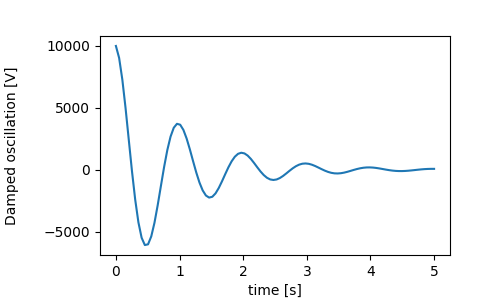
레이블을 이동하려면 labelpad 키워드 인수를 지정할 수 있습니다. 여기서 값은 포인트(1/72", 글꼴 크기를 지정하는 데 사용되는 것과 동일한 단위)입니다.
fig, ax = plt.subplots(figsize=(5, 3))
fig.subplots_adjust(bottom=0.15, left=0.2)
ax.plot(x1, y1*10000)
ax.set_xlabel('time [s]')
ax.set_ylabel('Damped oscillation [V]', labelpad=18)

plt.show()
또는 레이블 은 수동으로 레이블 위치를 지정할 수 있는 위치Text 를 포함하여 모든 키워드 인수를
허용합니다. 여기서 xlabel을 축의 맨 왼쪽에 배치합니다. 이 위치의 y 좌표는 영향을 미치지 않습니다. y 위치를 조정하려면
labelpad 키워드 인수를 사용해야 합니다.
fig, ax = plt.subplots(figsize=(5, 3))
fig.subplots_adjust(bottom=0.15, left=0.2)
ax.plot(x1, y1)
ax.set_xlabel('time [s]', position=(0., 1e6), horizontalalignment='left')
ax.set_ylabel('Damped oscillation [V]')

plt.show()
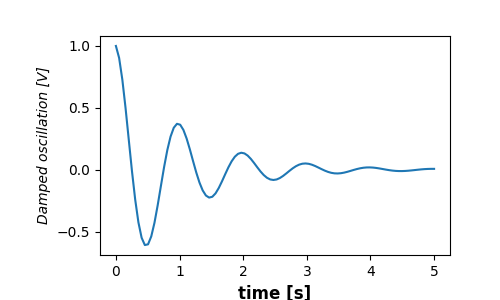
matplotlib.font_manager.FontProperties이 튜토리얼의 모든 라벨링은 메서드를 조작하거나 명명된 키워드 인수를 사용하여 변경할 수 있습니다.
set_xlabel
from matplotlib.font_manager import FontProperties

font = FontProperties()
font.set_family('serif')
font.set_name('Times New Roman')
font.set_style('italic')

fig, ax = plt.subplots(figsize=(5, 3))
fig.subplots_adjust(bottom=0.15, left=0.2)
ax.plot(x1, y1)
ax.set_xlabel('time [s]', fontsize='large', fontweight='bold')
ax.set_ylabel('Damped oscillation [V]', fontproperties=font)

plt.show()
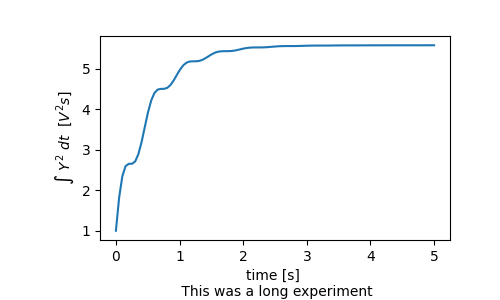
마지막으로 모든 텍스트 개체에서 기본 TeX 렌더링을 사용할 수 있으며 여러 줄을 가질 수 있습니다.
fig, ax = plt.subplots(figsize=(5, 3))
fig.subplots_adjust(bottom=0.2, left=0.2)
ax.plot(x1, np.cumsum(y1**2))
ax.set_xlabel('time [s] \n This was a long experiment')
ax.set_ylabel(r'$\int\ Y^2\ dt\ \ [V^2 s]$')
plt.show()
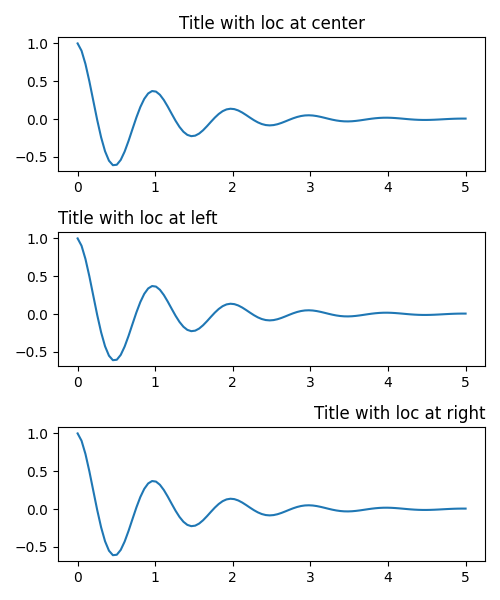
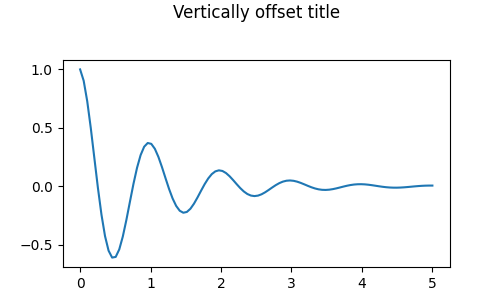
제목 #
서브플롯 제목은 레이블과 거의 같은 방식으로 설정되지만 기본값인 에서 위치와 정당성을 변경할 수 있는 locloc=center 키워드 인수가 있습니다 .
제목의 세로 간격은 rcParams["axes.titlepad"](기본값: 6.0)을 통해 제어됩니다. 다른 값으로 설정하면 제목이 이동합니다.
fig, ax = plt.subplots(figsize=(5, 3))
fig.subplots_adjust(top=0.8)
ax.plot(x1, y1)
ax.set_title('Vertically offset title', pad=30)
plt.show()
눈금 및 눈금 레이블 #
눈금과 눈금 라벨을 배치하는 것은 그림을 만드는 데 있어서 매우 까다로운 부분입니다. Matplotlib은 작업을 자동으로 수행하기 위해 최선을 다하지만 눈금 위치 선택과 레이블 지정 방법을 결정하기 위한 매우 유연한 프레임워크도 제공합니다.
용어 #
축 에는 축의 레이블이 배치되는 방식에 대한 정보를 포함하는 및
에 대한 matplotlib.axis.Axis개체가 있습니다.ax.xaxisax.yaxis
축 API는 설명서에 자세히 설명되어
axis있습니다.
Axis 객체에는 메이저 및 마이너 틱이 있습니다. Axis에는
메이저 Axis.set_major_locator및 Axis.set_minor_locator마이너 틱의 위치를 결정하기 위해 플로팅되는 데이터를 사용하는 메서드가 있습니다. 눈금 레이블의 형식을 지정하는 메서드 Axis.set_major_formatter도 있습니다 .Axis.set_minor_formatter
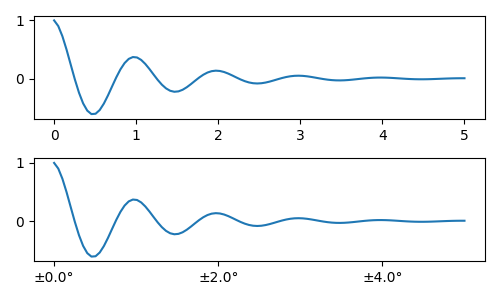
단순 틱 #
기본 로케이터와 포매터를 재정의하여 눈금 값과 때로는 눈금 레이블을 간단히 정의하는 것이 편리한 경우가 많습니다. 이것은 플롯의 대화식 탐색을 중단하기 때문에 권장되지 않습니다. 또한 축 제한을 재설정할 수 있습니다. 두 번째 플롯에는 자동 보기 제한을 훨씬 벗어난 항목을 포함하여 요청한 틱이 있습니다.
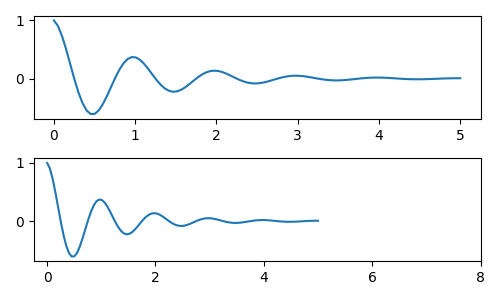
물론 사후에 이 문제를 고칠 수 있지만 진드기를 하드 코딩하는 약점을 강조합니다. 이 예에서는 눈금의 형식도 변경합니다.
fig, axs = plt.subplots(2, 1, figsize=(5, 3), tight_layout=True)
axs[0].plot(x1, y1)
axs[1].plot(x1, y1)
ticks = np.arange(0., 8.1, 2.)
# list comprehension to get all tick labels...
tickla = [f'{tick:1.2f}' for tick in ticks]
axs[1].xaxis.set_ticks(ticks)
axs[1].xaxis.set_ticklabels(tickla)
axs[1].set_xlim(axs[0].get_xlim())
plt.show()
틱 로케이터 및 포매터 #
모든 눈금 레이블 목록을 만드는 대신 matplotlib.ticker.StrMethodFormatter(새로운 스타일 str.format()
형식 문자열) 또는 matplotlib.ticker.FormatStrFormatter(이전 스타일 '%' 형식 문자열)을 사용하여 ax.xaxis. 형식기를 명시적으로 만들지 않고도 matplotlib.ticker.StrMethodFormattera를 전달하여
A
를 만들 수도 있습니다.str
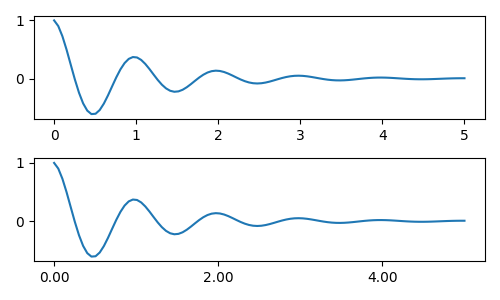
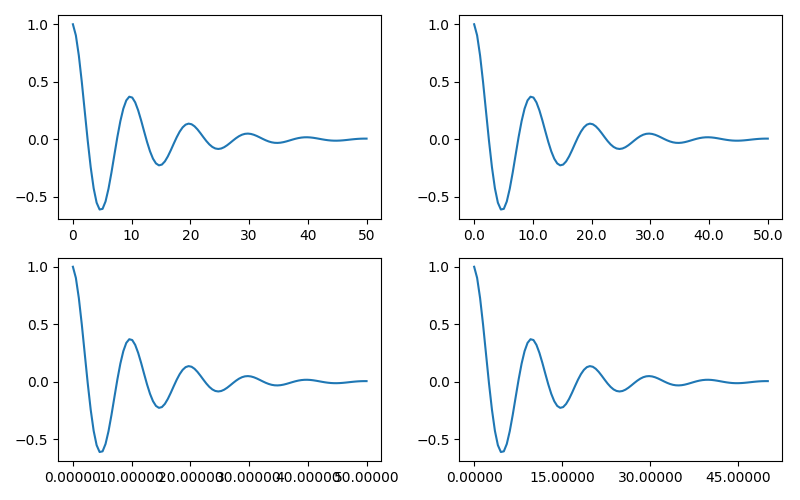
물론 기본이 아닌 로케이터를 사용하여 틱 위치를 설정할 수도 있습니다. 우리는 여전히 눈금 값을 전달하지만 위에서 사용된 x-limit 수정은 필요 하지 않습니다.
기본 포맷터는 다음 matplotlib.ticker.MaxNLocator과 같습니다
. 단계 키워드에는 눈금 값에 사용할 수 있는 배수 목록이 포함되어 있습니다. 즉, 이 경우 20, 40, 60 또는 0.2, 0.4, 0.6과 같이 2, 4, 6이 허용 가능한 틱입니다. 그러나 3, 6, 9는 단계 목록에 3이 나타나지 않기 때문에 허용되지 않습니다.ticker.MaxNLocator(self, nbins='auto', steps=[1, 2, 2.5, 5, 10])
nbins=auto알고리즘을 사용하여 축의 길이에 따라 허용되는 틱 수를 결정합니다. ticklabel의 fontsize는 고려되지만, tick 문자열의 길이는 아직 알려지지 않았기 때문입니다. 맨 아래 행에는 ticklabels가 상당히 크기 때문에 nbins=4레이블이 오른쪽에 맞도록 설정했습니다. 핸드 플롯.
fig, axs = plt.subplots(2, 2, figsize=(8, 5), tight_layout=True)
for n, ax in enumerate(axs.flat):
    ax.plot(x1*10., y1)

formatter = matplotlib.ticker.FormatStrFormatter('%1.1f')
locator = matplotlib.ticker.MaxNLocator(nbins='auto', steps=[1, 4, 10])
axs[0, 1].xaxis.set_major_locator(locator)
axs[0, 1].xaxis.set_major_formatter(formatter)

formatter = matplotlib.ticker.FormatStrFormatter('%1.5f')
locator = matplotlib.ticker.AutoLocator()
axs[1, 0].xaxis.set_major_formatter(formatter)
axs[1, 0].xaxis.set_major_locator(locator)

formatter = matplotlib.ticker.FormatStrFormatter('%1.5f')
locator = matplotlib.ticker.MaxNLocator(nbins=4)
axs[1, 1].xaxis.set_major_formatter(formatter)
axs[1, 1].xaxis.set_major_locator(locator)

plt.show()
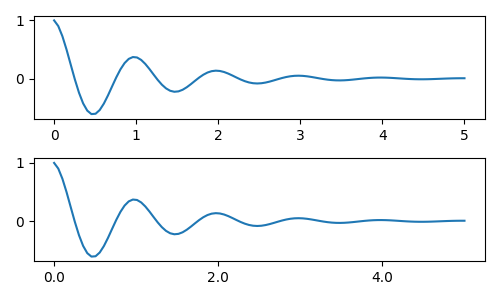
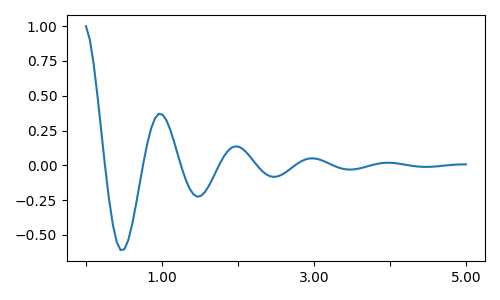
마지막으로 를 사용하여 포맷터의 기능을 지정할 수 있습니다
matplotlib.ticker.FuncFormatter. 또한 처럼
matplotlib.ticker.StrMethodFormatter함수를 전달하면 자동으로 matplotlib.ticker.FuncFormatter.
def formatoddticks(x, pos):
    """Format odd tick positions."""
    if x % 2:
        return f'{x:1.2f}'
    else:
        return ''


fig, ax = plt.subplots(figsize=(5, 3), tight_layout=True)
ax.plot(x1, y1)
locator = matplotlib.ticker.MaxNLocator(nbins=6)
ax.xaxis.set_major_formatter(formatoddticks)
ax.xaxis.set_major_locator(locator)

plt.show()
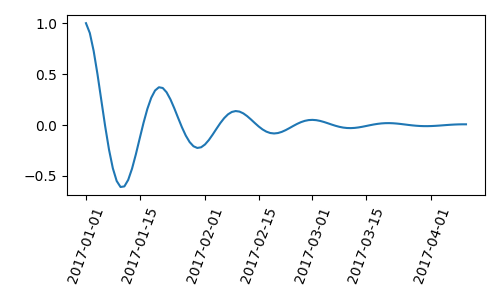
날짜 표시 #
Matplotlib는
플로팅 인수로 객체를 datetime.datetime허용 할 수 있습니다. numpy.datetime64날짜와 시간에는 특별한 형식이 필요하므로 종종 수동 개입이 도움이 될 수 있습니다. 이를 돕기 위해 날짜에는 matplotlib.dates모듈에 정의된 특수 로케이터 및 포맷터가 있습니다.
간단한 예는 다음과 같습니다. 눈금 레이블이 서로 오버런되지 않도록 회전해야 하는 방법에 유의하십시오.
import datetime

fig, ax = plt.subplots(figsize=(5, 3), tight_layout=True)
base = datetime.datetime(2017, 1, 1, 0, 0, 1)
time = [base + datetime.timedelta(days=x) for x in range(len(x1))]

ax.plot(time, y1)
ax.tick_params(axis='x', rotation=70)
plt.show()
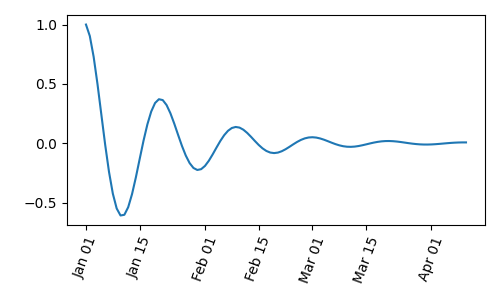
에 형식을 전달할 수 있습니다 matplotlib.dates.DateFormatter. 또한 29일과 다음 달은 매우 가깝습니다. dates.DayLocator사용할 날짜 목록을 지정할 수 있는 클래스 를 사용하여 이 문제를 해결할 수 있습니다. matplotlib.dates
유사한 포맷터가 모듈 에 나열되어 있습니다 .
import matplotlib.dates as mdates

locator = mdates.DayLocator(bymonthday=[1, 15])
formatter = mdates.DateFormatter('%b %d')

fig, ax = plt.subplots(figsize=(5, 3), tight_layout=True)
ax.xaxis.set_major_locator(locator)
ax.xaxis.set_major_formatter(formatter)
ax.plot(time, y1)
ax.tick_params(axis='x', rotation=70)
plt.show()
범례 및 주석 #
스크립트의 총 실행 시간: ( 0분 5.998초)