메모
전체 예제 코드를 다운로드 하려면 여기 를 클릭 하십시오.
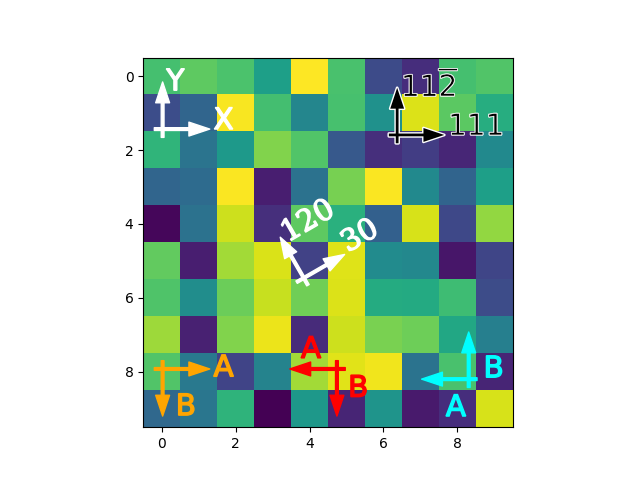
고정된 방향 화살표 #

import matplotlib.pyplot as plt
import numpy as np
from mpl_toolkits.axes_grid1.anchored_artists import AnchoredDirectionArrows
import matplotlib.font_manager as fm


# Fixing random state for reproducibility
np.random.seed(19680801)

fig, ax = plt.subplots()
ax.imshow(np.random.random((10, 10)))

# Simple example
simple_arrow = AnchoredDirectionArrows(ax.transAxes, 'X', 'Y')
ax.add_artist(simple_arrow)

# High contrast arrow
high_contrast_part_1 = AnchoredDirectionArrows(
                            ax.transAxes,
                            '111', r'11$\overline{2}$',
                            loc='upper right',
                            arrow_props={'ec': 'w', 'fc': 'none', 'alpha': 1,
                                         'lw': 2}
                            )
ax.add_artist(high_contrast_part_1)

high_contrast_part_2 = AnchoredDirectionArrows(
                            ax.transAxes,
                            '111', r'11$\overline{2}$',
                            loc='upper right',
                            arrow_props={'ec': 'none', 'fc': 'k'},
                            text_props={'ec': 'w', 'fc': 'k', 'lw': 0.4}
                            )
ax.add_artist(high_contrast_part_2)

# Rotated arrow
fontprops = fm.FontProperties(family='serif')

rotated_arrow = AnchoredDirectionArrows(
                    ax.transAxes,
                    '30', '120',
                    loc='center',
                    color='w',
                    angle=30,
                    fontproperties=fontprops
                    )
ax.add_artist(rotated_arrow)

# Altering arrow directions
a1 = AnchoredDirectionArrows(
        ax.transAxes, 'A', 'B', loc='lower center',
        length=-0.15,
        sep_x=0.03, sep_y=0.03,
        color='r'
    )
ax.add_artist(a1)

a2 = AnchoredDirectionArrows(
        ax.transAxes, 'A', ' B', loc='lower left',
        aspect_ratio=-1,
        sep_x=0.01, sep_y=-0.02,
        color='orange'
        )
ax.add_artist(a2)


a3 = AnchoredDirectionArrows(
        ax.transAxes, ' A', 'B', loc='lower right',
        length=-0.15,
        aspect_ratio=-1,
        sep_y=-0.1, sep_x=0.04,
        color='cyan'
        )
ax.add_artist(a3)

plt.show()