메모
전체 예제 코드를 다운로드 하려면 여기 를 클릭 하십시오.
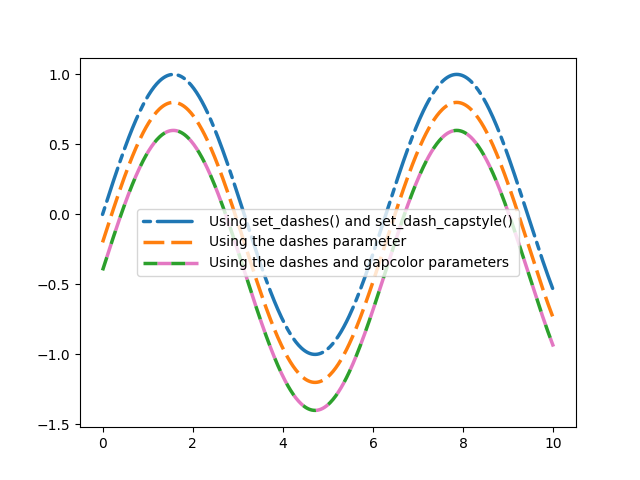
파선 스타일 사용자 지정 #
선의 대시는 대시 시퀀스를 통해 제어됩니다. 를 사용하여 수정할 수 있습니다 Line2D.set_dashes.
대시 시퀀스는 포인트의 일련의 켜짐/꺼짐 길이입니다. 예를 들어
1pt 공백으로 구분된 3pt 긴 줄이 될 수 있습니다.[3, 1]
같은 일부 함수는 Axes.plotLine 속성을 키워드 인수로 전달하는 것을 지원합니다. 이 경우 선을 만들 때 이미 대시를 설정할 수 있습니다.
참고 : 대시 스타일은 키워드 dashes 를 사용하여 대시 시퀀스 목록을 cycler 에 전달하여 property_cycle 을 통해 구성할 수도 있습니다 . 이 예제에서는 표시되지 않습니다.
set_dash_capstyle대시의 다른 속성은 관련 메서드( , set_dash_joinstyle,
set_gapcolor)를 사용하거나 플로팅 함수를 통해 속성을 전달하여 설정할 수도 있습니다 .
import numpy as np
import matplotlib.pyplot as plt

x = np.linspace(0, 10, 500)
y = np.sin(x)

plt.rc('lines', linewidth=2.5)
fig, ax = plt.subplots()

# Using set_dashes() and set_capstyle() to modify dashing of an existing line.
line1, = ax.plot(x, y, label='Using set_dashes() and set_dash_capstyle()')
line1.set_dashes([2, 2, 10, 2])  # 2pt line, 2pt break, 10pt line, 2pt break.
line1.set_dash_capstyle('round')

# Using plot(..., dashes=...) to set the dashing when creating a line.
line2, = ax.plot(x, y - 0.2, dashes=[6, 2], label='Using the dashes parameter')

# Using plot(..., dashes=..., gapcolor=...) to set the dashing and
# alternating color when creating a line.
line3, = ax.plot(x, y - 0.4, dashes=[4, 4], gapcolor='tab:pink',
                 label='Using the dashes and gapcolor parameters')

ax.legend(handlelength=4)
plt.show()