메모
전체 예제 코드를 다운로드 하려면 여기 를 클릭 하십시오.
그래디언트가 있는 막대 차트 #
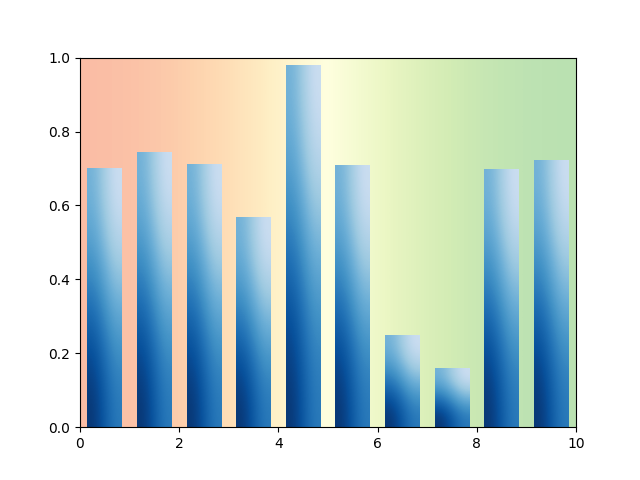
Matplotlib은 기본적으로 그래디언트를 지원하지 않습니다. AxesImage그러나 올바른 크기와 색상 으로 그래디언트로 채워진 사각형을 에뮬레이트할 수 있습니다 .
특히 컬러맵을 사용하여 실제 색상을 생성합니다. 그런 다음 이미지 모서리에 기본 값을 정의하고 쌍입방 보간으로 영역을 채우는 것으로 충분합니다. 단위 벡터 v 로 그래디언트 방향을 정의합니다 . 모서리의 값은 v 에 대한 모서리 벡터의 투영 길이로 구합니다 .
유사한 접근 방식을 사용하여 Axes에 대한 그라데이션 배경을 만들 수 있습니다. 이 경우 데이터 좌표와 독립된 Axes 좌표( )를 사용하는 것이 도움이 됩니다 .extent=(0, 1, 0, 1),
transform=ax.transAxes

import matplotlib.pyplot as plt
import numpy as np

np.random.seed(19680801)


def gradient_image(ax, extent, direction=0.3, cmap_range=(0, 1), **kwargs):
    """
    Draw a gradient image based on a colormap.

    Parameters
    ----------
    ax : Axes
        The axes to draw on.
    extent
        The extent of the image as (xmin, xmax, ymin, ymax).
        By default, this is in Axes coordinates but may be
        changed using the *transform* keyword argument.
    direction : float
        The direction of the gradient. This is a number in
        range 0 (=vertical) to 1 (=horizontal).
    cmap_range : float, float
        The fraction (cmin, cmax) of the colormap that should be
        used for the gradient, where the complete colormap is (0, 1).
    **kwargs
        Other parameters are passed on to `.Axes.imshow()`.
        In particular useful is *cmap*.
    """
    phi = direction * np.pi / 2
    v = np.array([np.cos(phi), np.sin(phi)])
    X = np.array([[v @ [1, 0], v @ [1, 1]],
                  [v @ [0, 0], v @ [0, 1]]])
    a, b = cmap_range
    X = a + (b - a) / X.max() * X
    im = ax.imshow(X, extent=extent, interpolation='bicubic',
                   vmin=0, vmax=1, **kwargs)
    return im


def gradient_bar(ax, x, y, width=0.5, bottom=0):
    for left, top in zip(x, y):
        right = left + width
        gradient_image(ax, extent=(left, right, bottom, top),
                       cmap=plt.cm.Blues_r, cmap_range=(0, 0.8))


xmin, xmax = xlim = 0, 10
ymin, ymax = ylim = 0, 1

fig, ax = plt.subplots()
ax.set(xlim=xlim, ylim=ylim, autoscale_on=False)

# background image
gradient_image(ax, direction=1, extent=(0, 1, 0, 1), transform=ax.transAxes,
               cmap=plt.cm.RdYlGn, cmap_range=(0.2, 0.8), alpha=0.5)

N = 10
x = np.arange(N) + 0.15
y = np.random.rand(N)
gradient_bar(ax, x, y, width=0.7)
ax.set_aspect('auto')
plt.show()