메모
전체 예제 코드를 다운로드 하려면 여기 를 클릭 하십시오.
윤곽선 데모 #
간단한 등고선 플로팅, 윤곽선에 대한 컬러바가 있는 이미지의 윤곽선 및 레이블이 지정된 윤곽선을 보여줍니다.
등고선 이미지 예도 참조하십시오 .
기본 색을 사용하여 레이블이 있는 간단한 등고선 플롯을 만듭니다. clabel에 대한 인라인 인수는 레이블이 등고선의 선분 위에 그려져 레이블 아래의 선을 제거하는지 여부를 제어합니다.
fig, ax = plt.subplots()
CS = ax.contour(X, Y, Z)
ax.clabel(CS, inline=True, fontsize=10)
ax.set_title('Simplest default with labels')

Text(0.5, 1.0, 'Simplest default with labels')
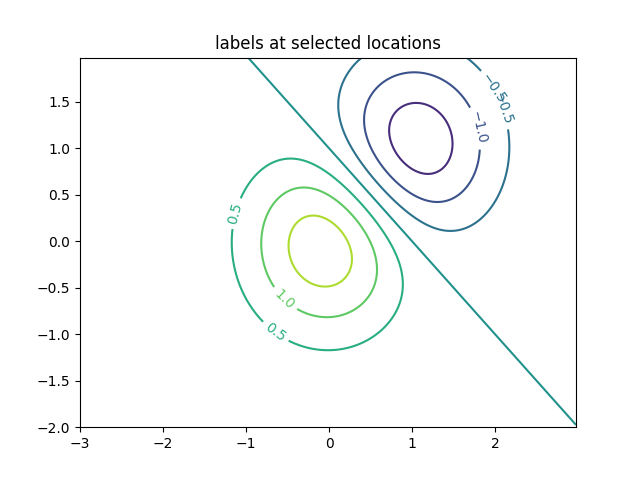
등고선 레이블은 위치 목록(데이터 좌표)을 제공하여 수동으로 배치할 수 있습니다. 대화식 배치를 위한 대화식 기능 을 참조하십시오 .
fig, ax = plt.subplots()
CS = ax.contour(X, Y, Z)
manual_locations = [
    (-1, -1.4), (-0.62, -0.7), (-2, 0.5), (1.7, 1.2), (2.0, 1.4), (2.4, 1.7)]
ax.clabel(CS, inline=True, fontsize=10, manual=manual_locations)
ax.set_title('labels at selected locations')
Text(0.5, 1.0, 'labels at selected locations')
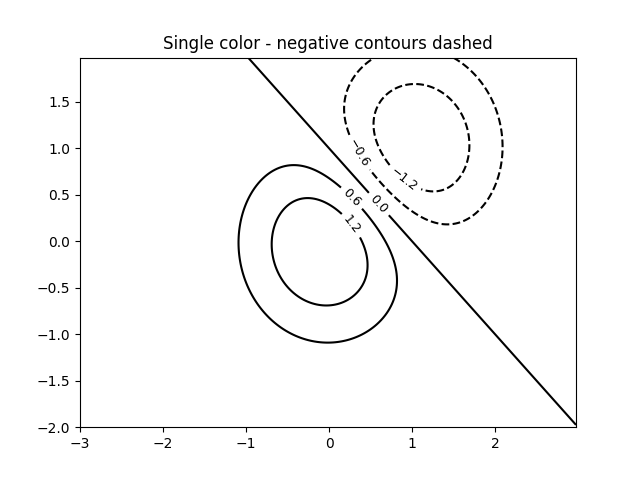
모든 등고선이 같은 색상이 되도록 강제할 수 있습니다.
fig, ax = plt.subplots()
CS = ax.contour(X, Y, Z, 6, colors='k')  # Negative contours default to dashed.
ax.clabel(CS, fontsize=9, inline=True)
ax.set_title('Single color - negative contours dashed')
Text(0.5, 1.0, 'Single color - negative contours dashed')
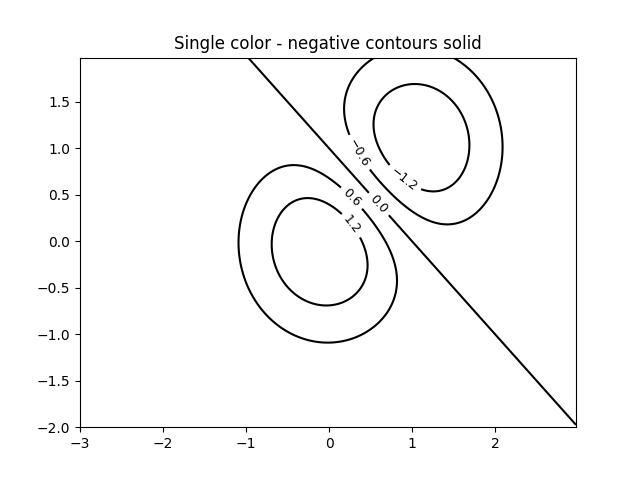
점선 대신 실선으로 음수 윤곽선을 설정할 수 있습니다.
plt.rcParams['contour.negative_linestyle'] = 'solid'
fig, ax = plt.subplots()
CS = ax.contour(X, Y, Z, 6, colors='k')  # Negative contours default to dashed.
ax.clabel(CS, fontsize=9, inline=True)
ax.set_title('Single color - negative contours solid')
Text(0.5, 1.0, 'Single color - negative contours solid')
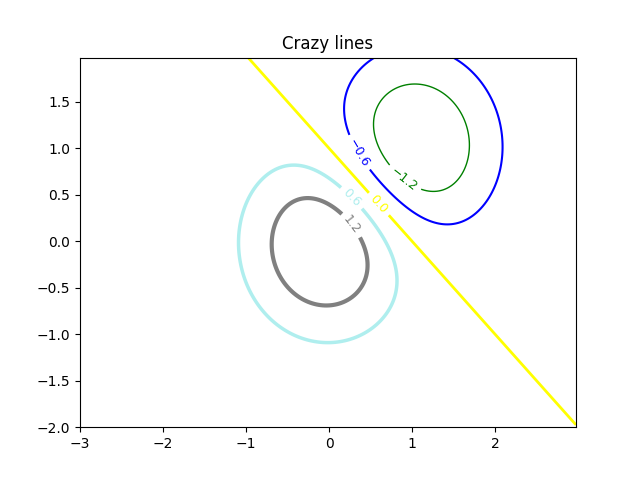
윤곽선의 색상을 수동으로 지정할 수 있습니다.
fig, ax = plt.subplots()
CS = ax.contour(X, Y, Z, 6,
                linewidths=np.arange(.5, 4, .5),
                colors=('r', 'green', 'blue', (1, 1, 0), '#afeeee', '0.5'),
                )
ax.clabel(CS, fontsize=9, inline=True)
ax.set_title('Crazy lines')
Text(0.5, 1.0, 'Crazy lines')
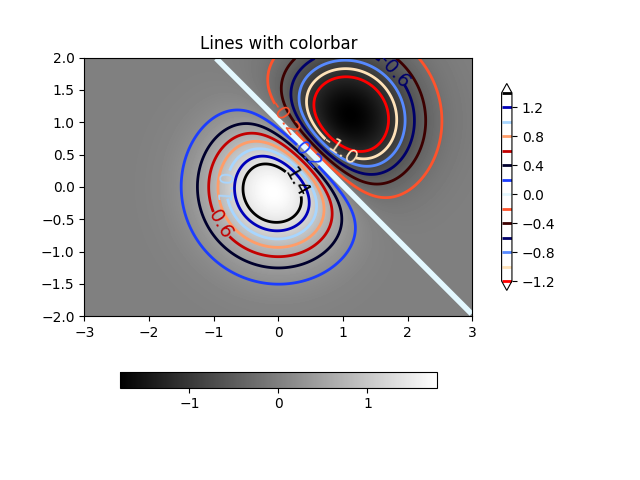
또는 컬러맵을 사용하여 색상을 지정할 수 있습니다. 등고선에는 기본 컬러맵이 사용됩니다.
fig, ax = plt.subplots()
im = ax.imshow(Z, interpolation='bilinear', origin='lower',
               cmap=cm.gray, extent=(-3, 3, -2, 2))
levels = np.arange(-1.2, 1.6, 0.2)
CS = ax.contour(Z, levels, origin='lower', cmap='flag', extend='both',
                linewidths=2, extent=(-3, 3, -2, 2))

# Thicken the zero contour.
CS.collections[6].set_linewidth(4)

ax.clabel(CS, levels[1::2],  # label every second level
          inline=True, fmt='%1.1f', fontsize=14)

# make a colorbar for the contour lines
CB = fig.colorbar(CS, shrink=0.8)

ax.set_title('Lines with colorbar')

# We can still add a colorbar for the image, too.
CBI = fig.colorbar(im, orientation='horizontal', shrink=0.8)

# This makes the original colorbar look a bit out of place,
# so let's improve its position.

l, b, w, h = ax.get_position().bounds
ll, bb, ww, hh = CB.ax.get_position().bounds
CB.ax.set_position([ll, b + 0.1*h, ww, h*0.8])

plt.show()
참조
다음 함수, 메서드, 클래스 및 모듈의 사용이 이 예제에 표시됩니다.
스크립트의 총 실행 시간: ( 0분 2.685초)