메모
전체 예제 코드를 다운로드 하려면 여기 를 클릭 하십시오.
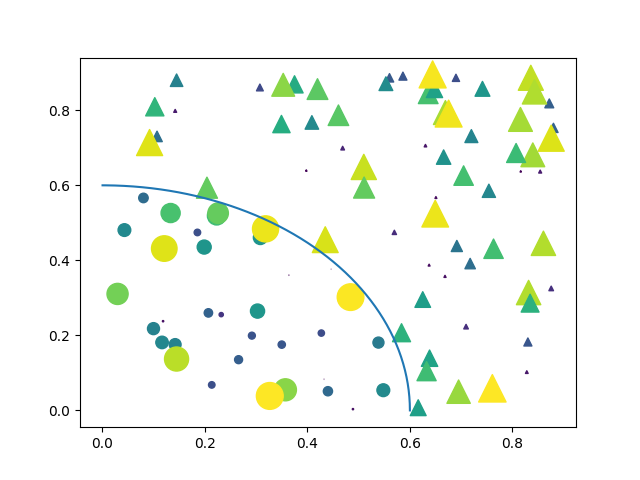
스캐터 마스크 #
일부 데이터 포인트를 마스크하고 마스크 영역을 구분하는 선을 추가합니다.
import matplotlib.pyplot as plt
import numpy as np

# Fixing random state for reproducibility
np.random.seed(19680801)


N = 100
r0 = 0.6
x = 0.9 * np.random.rand(N)
y = 0.9 * np.random.rand(N)
area = (20 * np.random.rand(N))**2  # 0 to 10 point radii
c = np.sqrt(area)
r = np.sqrt(x ** 2 + y ** 2)
area1 = np.ma.masked_where(r < r0, area)
area2 = np.ma.masked_where(r >= r0, area)
plt.scatter(x, y, s=area1, marker='^', c=c)
plt.scatter(x, y, s=area2, marker='o', c=c)
# Show the boundary between the regions:
theta = np.arange(0, np.pi / 2, 0.01)
plt.plot(r0 * np.cos(theta), r0 * np.sin(theta))

plt.show()