메모
전체 예제 코드를 다운로드 하려면 여기 를 클릭 하십시오.
날짜 정밀도 및 에포크 #
Matplotlib는 이러한 날짜를 인식하고 부동 소수점 숫자로 변환하는 단위 변환기를 사용하여 datetime객체와 객체를 처리할 수 있습니다.numpy.datetime64
Matplotlib 3.3 이전에는 이 변환의 기본값이 "0000-12-31T00:00:00" 이후 일수인 float를 반환합니다. Matplotlib 3.3부터 기본값은 "1970-01-01T00:00:00"의 날짜입니다. 이를 통해 현대 날짜에 대해 더 많은 해상도를 얻을 수 있습니다. 이전 에포크가 730120으로 변환되고 64비트 부동 소수점 숫자의 분해능이 2^{-52} 또는 약 14마이크로초인 "2020-01-01"은 마이크로초 정밀도가 손실되었습니다. 새로운 기본 에포크 "2020-01-01"은 10957.0이므로 달성 가능한 해상도는 0.21마이크로초입니다.
import datetime
import numpy as np

import matplotlib.pyplot as plt
import matplotlib.dates as mdates


def _reset_epoch_for_tutorial():
    """
    Users (and downstream libraries) should not use the private method of
    resetting the epoch.
    """
    mdates._reset_epoch_test_example()
날짜 시간 #
Python datetime개체에는 마이크로초 해상도가 있으므로 이전 기본 matplotlib 날짜로는 전체 해상도 datetime 개체를 왕복할 수 없습니다.
old_epoch = '0000-12-31T00:00:00'
new_epoch = '1970-01-01T00:00:00'

_reset_epoch_for_tutorial()  # Don't do this.  Just for this tutorial.
mdates.set_epoch(old_epoch)  # old epoch (pre MPL 3.3)

date1 = datetime.datetime(2000, 1, 1, 0, 10, 0, 12,
                          tzinfo=datetime.timezone.utc)
mdate1 = mdates.date2num(date1)
print('Before Roundtrip: ', date1, 'Matplotlib date:', mdate1)
date2 = mdates.num2date(mdate1)
print('After Roundtrip:  ', date2)
Before Roundtrip:  2000-01-01 00:10:00.000012+00:00 Matplotlib date: 730120.0069444446
After Roundtrip:   2000-01-01 00:10:00.000020+00:00
이것은 반올림 오류일 뿐이며 이전 시대에 가까운 날짜에는 문제가 없습니다.
date1 = datetime.datetime(10, 1, 1, 0, 10, 0, 12,
                          tzinfo=datetime.timezone.utc)
mdate1 = mdates.date2num(date1)
print('Before Roundtrip: ', date1, 'Matplotlib date:', mdate1)
date2 = mdates.num2date(mdate1)
print('After Roundtrip:  ', date2)
Before Roundtrip:  0010-01-01 00:10:00.000012+00:00 Matplotlib date: 3288.006944444583
After Roundtrip:   0010-01-01 00:10:00.000012+00:00
사용자가 마이크로초 정밀도로 최신 날짜를 사용하려는 경우 를 사용하여 시대를 변경할 수 있습니다 set_epoch. 그러나 서로 다른 epoch 사이의 혼동을 방지하기 위해 날짜 작업 전에 epoch를 설정해야 합니다. 나중에 신기원을 변경하려고 하면 RuntimeError.
try:
    mdates.set_epoch(new_epoch)  # this is the new MPL 3.3 default.
except RuntimeError as e:
    print('RuntimeError:', str(e))
RuntimeError: set_epoch must be called before dates plotted.
이 자습서에서는 비공개 방법을 사용하여 센티넬을 재설정하지만 사용자는 에포크를 한 번만 설정해야 합니다.
_reset_epoch_for_tutorial()  # Just being done for this tutorial.
mdates.set_epoch(new_epoch)

date1 = datetime.datetime(2020, 1, 1, 0, 10, 0, 12,
                          tzinfo=datetime.timezone.utc)
mdate1 = mdates.date2num(date1)
print('Before Roundtrip: ', date1, 'Matplotlib date:', mdate1)
date2 = mdates.num2date(mdate1)
print('After Roundtrip:  ', date2)
Before Roundtrip:  2020-01-01 00:10:00.000012+00:00 Matplotlib date: 18262.006944444583
After Roundtrip:   2020-01-01 00:10:00.000012+00:00
datetime64 #
numpy.datetime64개체는 개체보다 훨씬 더 큰 시공간에 대해 마이크로초 정밀도를 갖습니다 datetime. 그러나 현재 Matplotlib 시간은 마이크로초 해상도와 0000에서 9999까지만 범위가 있는 연도를 가진 datetime 개체로만 다시 변환됩니다.
_reset_epoch_for_tutorial()  # Don't do this.  Just for this tutorial.
mdates.set_epoch(new_epoch)

date1 = np.datetime64('2000-01-01T00:10:00.000012')
mdate1 = mdates.date2num(date1)
print('Before Roundtrip: ', date1, 'Matplotlib date:', mdate1)
date2 = mdates.num2date(mdate1)
print('After Roundtrip:  ', date2)
Before Roundtrip:  2000-01-01T00:10:00.000012 Matplotlib date: 10957.006944444583
After Roundtrip:   2000-01-01 00:10:00.000012+00:00
플로팅 #
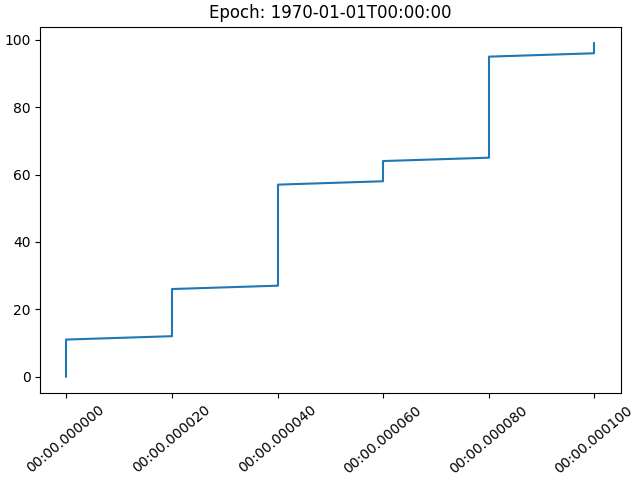
이것은 물론 플로팅에 영향을 미칩니다. 이전 기본 에포크에서는 내부 변환 중에 시간이 반올림 date2num되어 데이터가 점프했습니다.
_reset_epoch_for_tutorial()  # Don't do this.  Just for this tutorial.
mdates.set_epoch(old_epoch)

x = np.arange('2000-01-01T00:00:00.0', '2000-01-01T00:00:00.000100',
              dtype='datetime64[us]')
# simulate the plot being made using the old epoch
xold = np.array([mdates.num2date(mdates.date2num(d)) for d in x])
y = np.arange(0, len(x))

# resetting the Epoch so plots are comparable
_reset_epoch_for_tutorial()  # Don't do this.  Just for this tutorial.
mdates.set_epoch(new_epoch)

fig, ax = plt.subplots(constrained_layout=True)
ax.plot(xold, y)
ax.set_title('Epoch: ' + mdates.get_epoch())
ax.xaxis.set_tick_params(rotation=40)
plt.show()

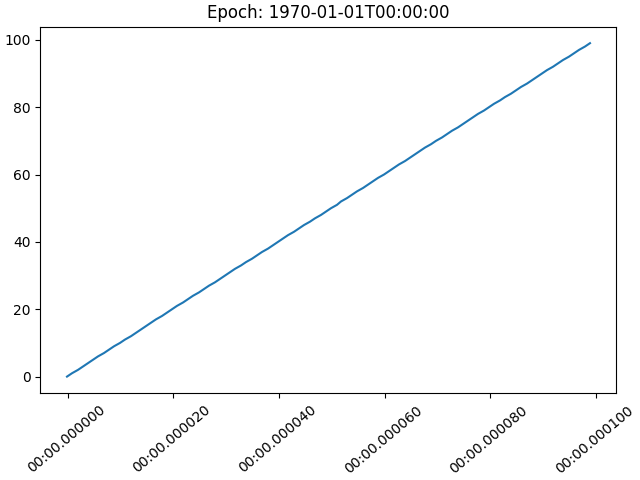
더 최근의 에포크를 사용하여 표시된 날짜의 경우 플롯이 매끄럽습니다.
fig, ax = plt.subplots(constrained_layout=True)
ax.plot(x, y)
ax.set_title('Epoch: ' + mdates.get_epoch())
ax.xaxis.set_tick_params(rotation=40)
plt.show()

_reset_epoch_for_tutorial()  # Don't do this.  Just for this tutorial.

참조
다음 함수, 메서드, 클래스 및 모듈의 사용이 이 예제에 표시됩니다.