메모
전체 예제 코드를 다운로드 하려면 여기 를 클릭 하십시오.
Pyplot Mathtext #
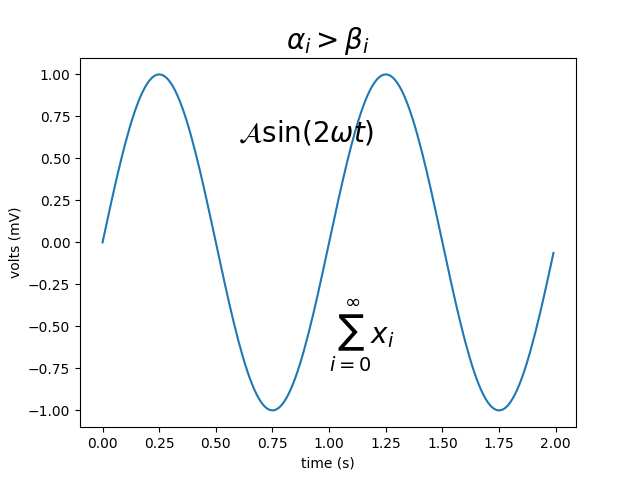
텍스트 레이블에 수학 표현식을 사용합니다. MathText에 대한 개요는 수학 표현식 작성 을 참조하십시오 .
import numpy as np
import matplotlib.pyplot as plt
t = np.arange(0.0, 2.0, 0.01)
s = np.sin(2*np.pi*t)

plt.plot(t, s)
plt.title(r'$\alpha_i > \beta_i$', fontsize=20)
plt.text(1, -0.6, r'$\sum_{i=0}^\infty x_i$', fontsize=20)
plt.text(0.6, 0.6, r'$\mathcal{A}\mathrm{sin}(2 \omega t)$',
         fontsize=20)
plt.xlabel('time (s)')
plt.ylabel('volts (mV)')
plt.show()
