메모
전체 예제 코드를 다운로드 하려면 여기 를 클릭 하십시오.
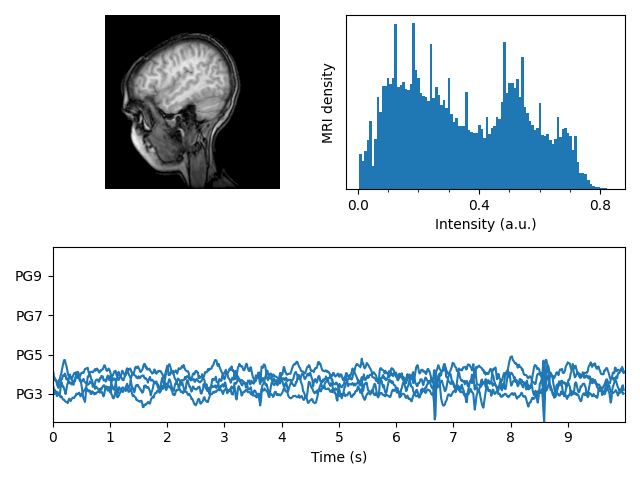
EEG가 있는 MRI #
MRI 이미지, 강도 히스토그램 및 일부 EEG 추적이 포함된 서브플롯 세트를 표시합니다.
import numpy as np
import matplotlib.pyplot as plt
import matplotlib.cbook as cbook
import matplotlib.cm as cm

from matplotlib.collections import LineCollection
from matplotlib.ticker import MultipleLocator

fig = plt.figure("MRI_with_EEG")

# Load the MRI data (256x256 16 bit integers)
with cbook.get_sample_data('s1045.ima.gz') as dfile:
    im = np.frombuffer(dfile.read(), np.uint16).reshape((256, 256))

# Plot the MRI image
ax0 = fig.add_subplot(2, 2, 1)
ax0.imshow(im, cmap=cm.gray)
ax0.axis('off')

# Plot the histogram of MRI intensity
ax1 = fig.add_subplot(2, 2, 2)
im = np.ravel(im)
im = im[np.nonzero(im)]  # Ignore the background
im = im / (2**16 - 1)  # Normalize
ax1.hist(im, bins=100)
ax1.xaxis.set_major_locator(MultipleLocator(0.4))
ax1.minorticks_on()
ax1.set_yticks([])
ax1.set_xlabel('Intensity (a.u.)')
ax1.set_ylabel('MRI density')

# Load the EEG data
n_samples, n_rows = 800, 4
with cbook.get_sample_data('eeg.dat') as eegfile:
    data = np.fromfile(eegfile, dtype=float).reshape((n_samples, n_rows))
t = 10 * np.arange(n_samples) / n_samples

# Plot the EEG
ticklocs = []
ax2 = fig.add_subplot(2, 1, 2)
ax2.set_xlim(0, 10)
ax2.set_xticks(np.arange(10))
dmin = data.min()
dmax = data.max()
dr = (dmax - dmin) * 0.7  # Crowd them a bit.
y0 = dmin
y1 = (n_rows - 1) * dr + dmax
ax2.set_ylim(y0, y1)

segs = []
for i in range(n_rows):
    segs.append(np.column_stack((t, data[:, i])))
    ticklocs.append(i * dr)

offsets = np.zeros((n_rows, 2), dtype=float)
offsets[:, 1] = ticklocs

lines = LineCollection(segs, offsets=offsets, offset_transform=None)
ax2.add_collection(lines)

# Set the yticks to use axes coordinates on the y axis
ax2.set_yticks(ticklocs, labels=['PG3', 'PG5', 'PG7', 'PG9'])

ax2.set_xlabel('Time (s)')


plt.tight_layout()
plt.show()