메모
전체 예제 코드를 다운로드 하려면 여기 를 클릭 하십시오.
커스텀 범례 작성하기 #
사용자 지정 범례를 하나씩 구성합니다.
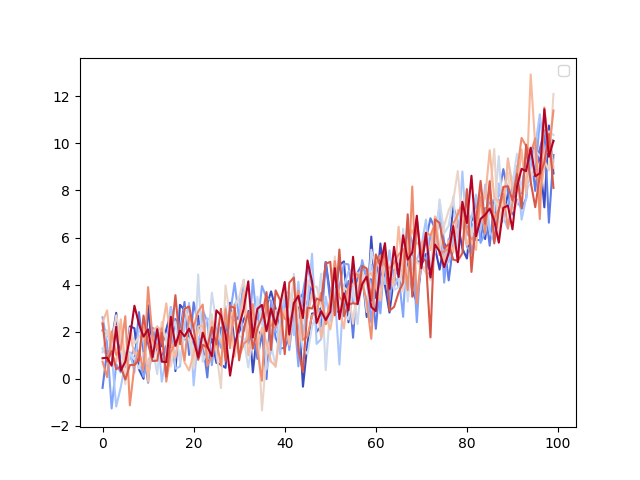
플로팅한 데이터에 명시적으로 연결된 범례를 원하지 않는 경우가 있습니다. 예를 들어, 10개의 선을 그렸지만 각 선에 대해 범례 항목이 표시되는 것을 원하지 않는다고 가정합니다. 단순히 선을 플로팅하고 를 호출 ax.legend()하면 다음을 얻을 수 있습니다.
import matplotlib as mpl
from matplotlib import cycler
import matplotlib.pyplot as plt
import numpy as np

# Fixing random state for reproducibility
np.random.seed(19680801)

N = 10
data = (np.geomspace(1, 10, 100) + np.random.randn(N, 100)).T
cmap = plt.cm.coolwarm
mpl.rcParams['axes.prop_cycle'] = cycler(color=cmap(np.linspace(0, 1, N)))

fig, ax = plt.subplots()
lines = ax.plot(data)
ax.legend()

No artists with labels found to put in legend.  Note that artists whose label start with an underscore are ignored when legend() is called with no argument.

<matplotlib.legend.Legend object at 0x7f2cf9d80c40>
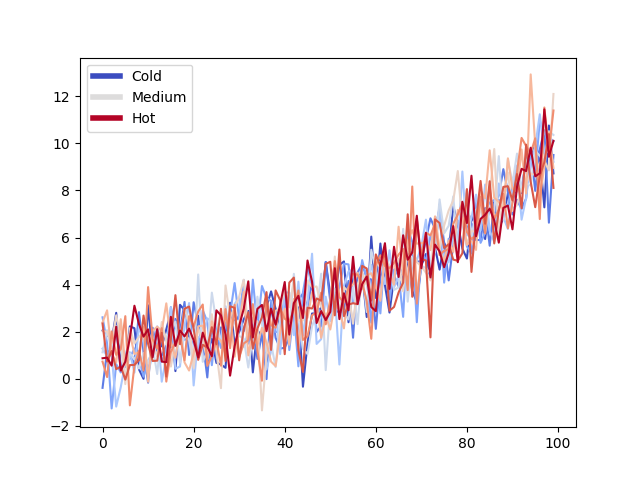
생성된 범례 항목이 없습니다. 이 경우 플롯된 데이터에 명시적으로 연결되지 않은 Matplotlib 개체를 사용하여 범례를 구성할 수 있습니다. 예를 들어:
from matplotlib.lines import Line2D
custom_lines = [Line2D([0], [0], color=cmap(0.), lw=4),
                Line2D([0], [0], color=cmap(.5), lw=4),
                Line2D([0], [0], color=cmap(1.), lw=4)]

fig, ax = plt.subplots()
lines = ax.plot(data)
ax.legend(custom_lines, ['Cold', 'Medium', 'Hot'])

<matplotlib.legend.Legend object at 0x7f2cfaadfac0>
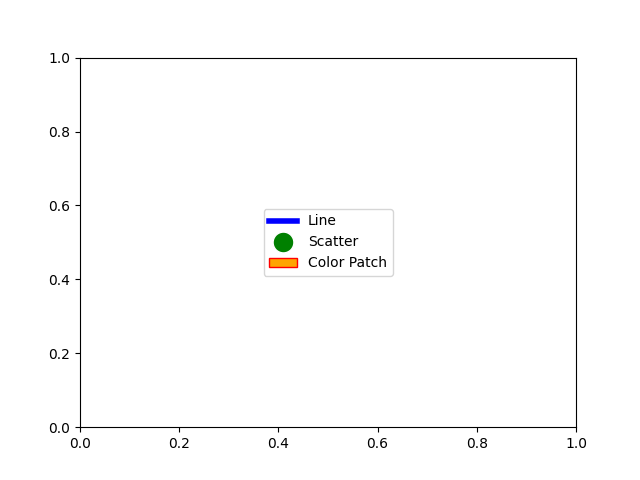
이런 방식으로 사용할 수 있는 다른 많은 Matplotlib 객체가 있습니다. 아래 코드에서 몇 가지 일반적인 코드를 나열했습니다.
from matplotlib.patches import Patch
from matplotlib.lines import Line2D

legend_elements = [Line2D([0], [0], color='b', lw=4, label='Line'),
                   Line2D([0], [0], marker='o', color='w', label='Scatter',
                          markerfacecolor='g', markersize=15),
                   Patch(facecolor='orange', edgecolor='r',
                         label='Color Patch')]

# Create the figure
fig, ax = plt.subplots()
ax.legend(handles=legend_elements, loc='center')

plt.show()

스크립트의 총 실행 시간: (0분 1.610초)