메모
전체 예제 코드를 다운로드 하려면 여기 를 클릭 하십시오.
# 을 사용하여 여러 서브플롯 만들기plt.subplots
pyplot.subplots단일 호출로 그림과 서브플롯 그리드를 생성하는 동시에 개별 플롯이 생성되는 방법에 대한 합리적인 제어를 제공합니다. 고급 사용 사례 의 경우 GridSpec보다 일반적인 서브플롯 레이아웃에 사용하거나 Figure.add_subplot그림 내의 임의 위치에 서브플롯을 추가하는 데 사용할 수 있습니다.
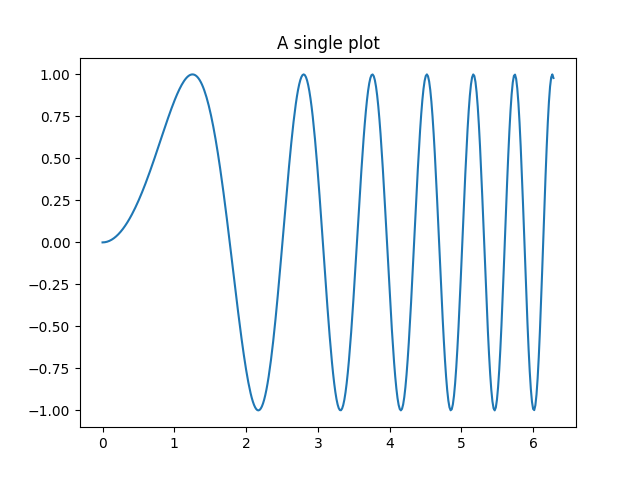
하나의 서브플롯만 있는 그림 #
subplots()인수가 없으면 a Figure및 single 을
반환합니다 Axes.
이것은 실제로 단일 Figure 및 Axes를 생성하는 가장 간단하고 권장되는 방법입니다.
fig, ax = plt.subplots()
ax.plot(x, y)
ax.set_title('A single plot')
Text(0.5, 1.0, 'A single plot')
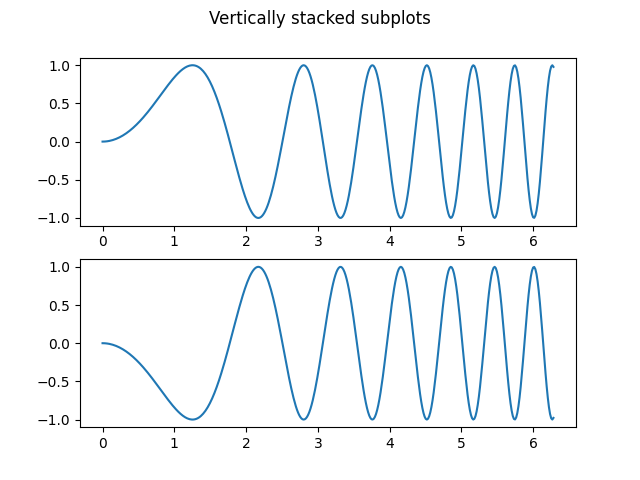
한 방향으로 서브플롯 쌓기 #
의 처음 두 선택적 인수 pyplot.subplots는 서브플롯 그리드의 행과 열 수를 정의합니다.
한 방향으로만 axs쌓을 때 생성된 Axes 목록을 포함하는 1D numpy 배열이 반환됩니다.
fig, axs = plt.subplots(2)
fig.suptitle('Vertically stacked subplots')
axs[0].plot(x, y)
axs[1].plot(x, -y)

[<matplotlib.lines.Line2D object at 0x7f2d00efd510>]
Axes를 몇 개만 생성하는 경우 각 Axes에 대한 전용 변수에 즉시 압축을 푸는 것이 편리합니다. 그렇게 ax1하면 보다 장황한 대신 사용할 수 있습니다 axs[0].
fig, (ax1, ax2) = plt.subplots(2)
fig.suptitle('Vertically stacked subplots')
ax1.plot(x, y)
ax2.plot(x, -y)
[<matplotlib.lines.Line2D object at 0x7f2d00a95b70>]
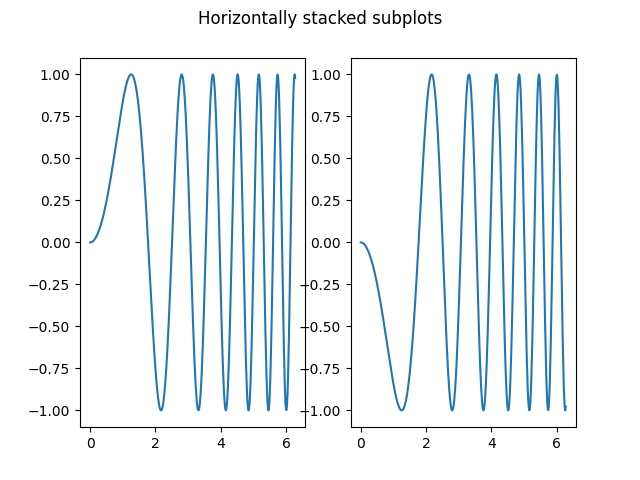
side-by-side 서브플롯을 얻으려면 하나의 행과 두 개의 열에 대한 매개변수를 전달하십시오.1, 2
fig, (ax1, ax2) = plt.subplots(1, 2)
fig.suptitle('Horizontally stacked subplots')
ax1.plot(x, y)
ax2.plot(x, -y)
[<matplotlib.lines.Line2D object at 0x7f2cfb43d330>]
두 방향으로 서브플롯 쌓기 #
두 방향으로 쌓을 때 반환 axs되는 것은 2D NumPy 배열입니다.
각 서브플롯에 대한 매개변수를 설정해야 하는 경우 를 사용하여 2D 그리드의 모든 서브플롯을 반복하는 것이 편리합니다 .for ax in axs.flat:
fig, axs = plt.subplots(2, 2)
axs[0, 0].plot(x, y)
axs[0, 0].set_title('Axis [0, 0]')
axs[0, 1].plot(x, y, 'tab:orange')
axs[0, 1].set_title('Axis [0, 1]')
axs[1, 0].plot(x, -y, 'tab:green')
axs[1, 0].set_title('Axis [1, 0]')
axs[1, 1].plot(x, -y, 'tab:red')
axs[1, 1].set_title('Axis [1, 1]')

for ax in axs.flat:
    ax.set(xlabel='x-label', ylabel='y-label')

# Hide x labels and tick labels for top plots and y ticks for right plots.
for ax in axs.flat:
    ax.label_outer()
![축 [0, 0], 축 [0, 1], 축 [1, 0], 축 [1, 1]](/stable/_images/sphx_glr_subplots_demo_005.png)
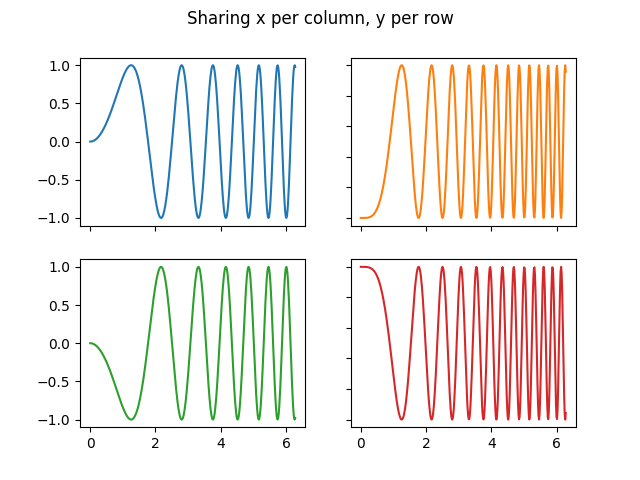
2D에서도 튜플 압축 해제를 사용하여 모든 서브플롯을 전용 변수에 할당할 수 있습니다.
fig, ((ax1, ax2), (ax3, ax4)) = plt.subplots(2, 2)
fig.suptitle('Sharing x per column, y per row')
ax1.plot(x, y)
ax2.plot(x, y**2, 'tab:orange')
ax3.plot(x, -y, 'tab:green')
ax4.plot(x, -y**2, 'tab:red')

for ax in fig.get_axes():
    ax.label_outer()
축 공유 #
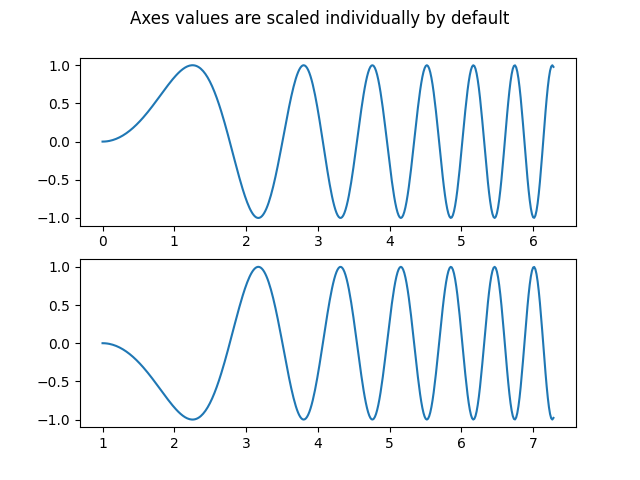
기본적으로 각 축은 개별적으로 크기가 조정됩니다. 따라서 범위가 다르면 서브플롯의 눈금 값이 정렬되지 않습니다.
fig, (ax1, ax2) = plt.subplots(2)
fig.suptitle('Axes values are scaled individually by default')
ax1.plot(x, y)
ax2.plot(x + 1, -y)
[<matplotlib.lines.Line2D object at 0x7f2cfb007250>]
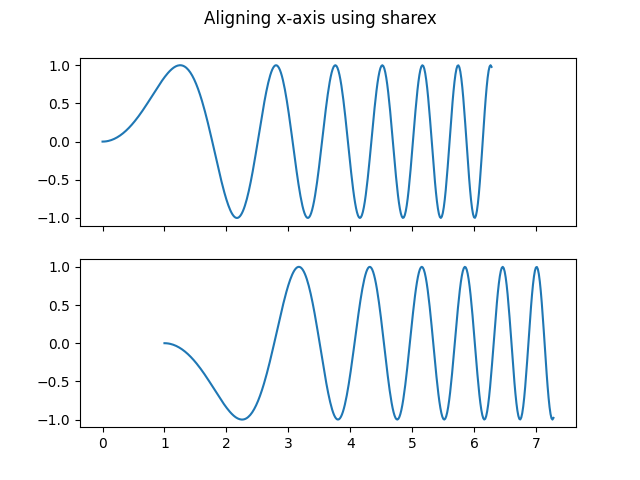
sharex 또는 sharey 를 사용 하여 가로 또는 세로 축을 정렬할 수 있습니다.
fig, (ax1, ax2) = plt.subplots(2, sharex=True)
fig.suptitle('Aligning x-axis using sharex')
ax1.plot(x, y)
ax2.plot(x + 1, -y)
[<matplotlib.lines.Line2D object at 0x7f2cfa993370>]
sharex 또는 sharey 를 설정 True하면 전체 그리드에서 전역 공유 가 가능합니다 sharey=True.
[<matplotlib.lines.Line2D object at 0x7f2cfab12980>]
축을 공유하는 서브플롯의 경우 하나의 눈금 레이블 세트로 충분합니다. 내부 축의 눈금 레이블은 sharex 및 sharey 에 의해 자동으로 제거됩니다 . 여전히 서브플롯 사이에 사용되지 않은 빈 공간이 남아 있습니다.
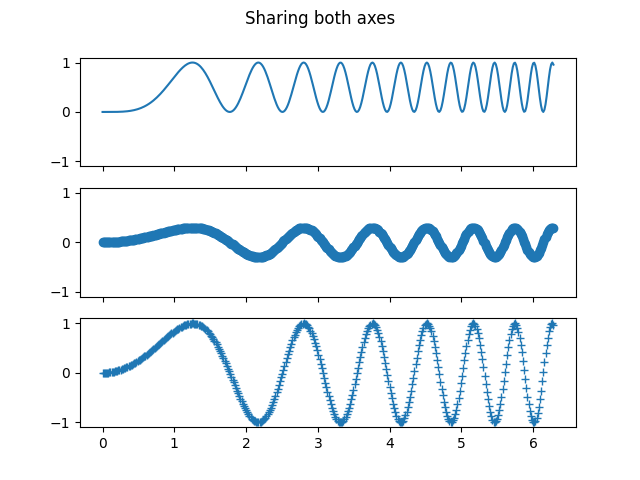
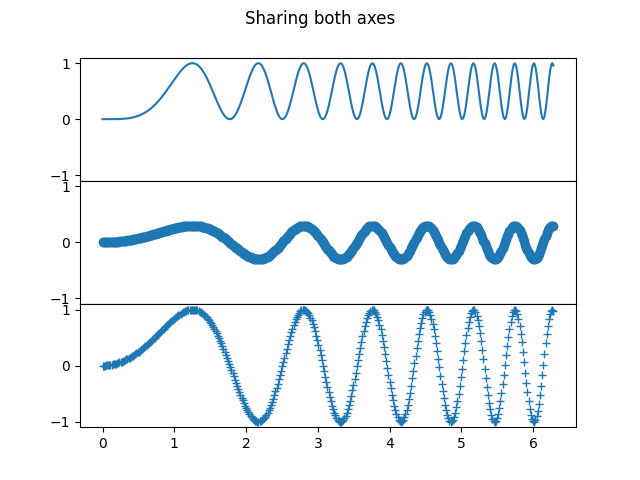
서브플롯의 위치를 정확하게 제어하기 위해 GridSpecwith 를 명시적으로 생성한 다음 해당 메서드 Figure.add_gridspec를 호출할
수 있습니다. subplots예를 들어, 를 사용하여 수직 서브플롯 사이의 높이를 줄일 수 있습니다 add_gridspec(hspace=0).
label_outer그리드의 가장자리에 있지 않은 서브플롯에서 레이블과 눈금을 제거하는 편리한 방법입니다.
fig = plt.figure()
gs = fig.add_gridspec(3, hspace=0)
axs = gs.subplots(sharex=True, sharey=True)
fig.suptitle('Sharing both axes')
axs[0].plot(x, y ** 2)
axs[1].plot(x, 0.3 * y, 'o')
axs[2].plot(x, y, '+')

# Hide x labels and tick labels for all but bottom plot.
for ax in axs:
    ax.label_outer()
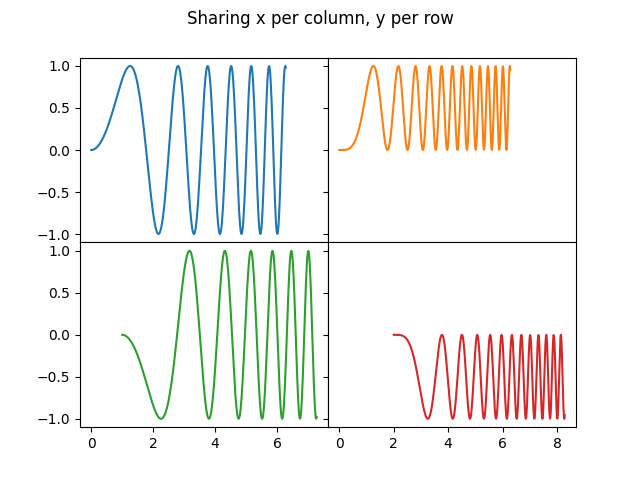
True와 별도로 , sharex 와 shareyFalse 모두 'row'와 'col' 값을 허용하여 행 또는 열별로 값을 공유합니다.
fig = plt.figure()
gs = fig.add_gridspec(2, 2, hspace=0, wspace=0)
(ax1, ax2), (ax3, ax4) = gs.subplots(sharex='col', sharey='row')
fig.suptitle('Sharing x per column, y per row')
ax1.plot(x, y)
ax2.plot(x, y**2, 'tab:orange')
ax3.plot(x + 1, -y, 'tab:green')
ax4.plot(x + 2, -y**2, 'tab:red')

for ax in axs.flat:
    ax.label_outer()
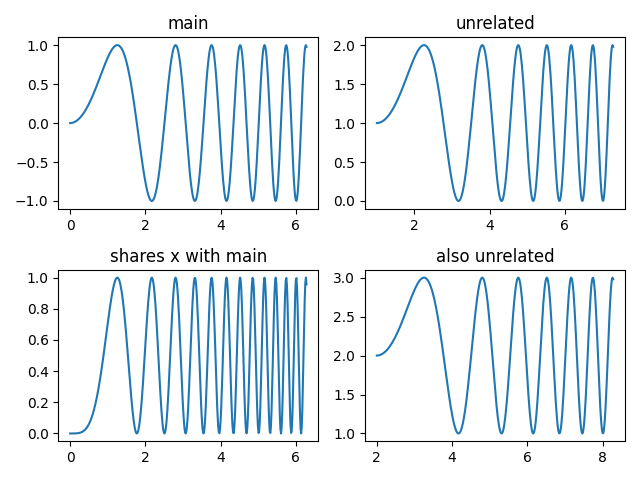
보다 복잡한 공유 구조를 원하는 경우 먼저 공유가 없는 축의 그리드를 생성한 다음 axes.Axes.sharex또는
호출 axes.Axes.sharey하여 공유 정보를 사후에 추가할 수 있습니다.
fig, axs = plt.subplots(2, 2)
axs[0, 0].plot(x, y)
axs[0, 0].set_title("main")
axs[1, 0].plot(x, y**2)
axs[1, 0].set_title("shares x with main")
axs[1, 0].sharex(axs[0, 0])
axs[0, 1].plot(x + 1, y + 1)
axs[0, 1].set_title("unrelated")
axs[1, 1].plot(x + 2, y + 2)
axs[1, 1].set_title("also unrelated")
fig.tight_layout()
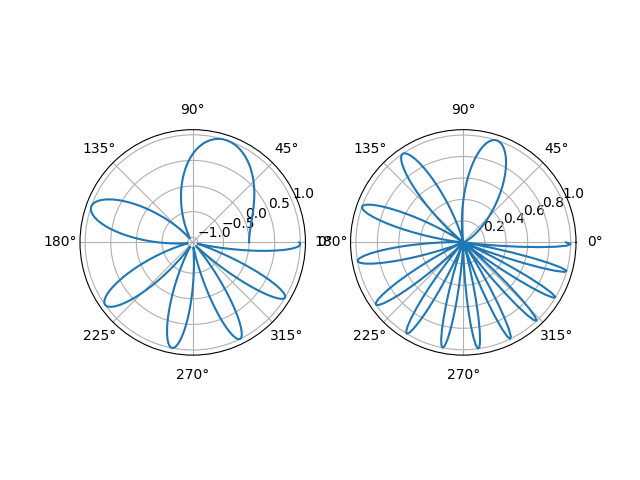
극축 #
subplot_kw 매개변수 는 서브플롯 속성 을 pyplot.subplots제어합니다( 참조 Figure.add_subplot). 특히 극좌표 축 그리드를 만드는 데 사용할 수 있습니다.
스크립트의 총 실행 시간: ( 0분 7.774초)