메모
전체 예제 코드를 다운로드 하려면 여기 를 클릭 하십시오.
눈금 사이의 중심 레이블 #
눈금 레이블은 연결된 눈금을 기준으로 정렬됩니다. 수평 정렬 속성을 사용하여 정렬 '가운데', '왼쪽' 또는 '오른쪽'을 제어할 수 있습니다.
for label in ax.get_xticklabels():
    label.set_horizontalalignment('right')
그러나 눈금 사이에 레이블을 중앙에 배치하는 직접적인 방법은 없습니다. 이 동작을 위조하려면 주요 눈금 사이에 있는 작은 눈금에 레이블을 배치하고 주요 눈금 레이블과 작은 눈금을 숨길 수 있습니다.
다음은 틱 사이의 중앙에 월 레이블을 지정하는 예입니다.
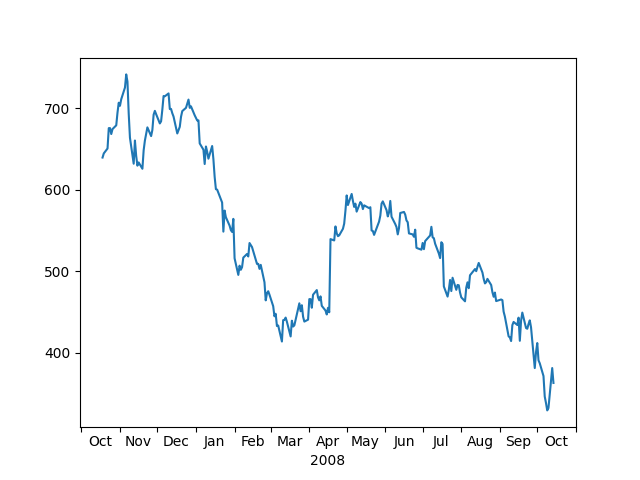
import numpy as np
import matplotlib.cbook as cbook
import matplotlib.dates as dates
import matplotlib.ticker as ticker
import matplotlib.pyplot as plt

# Load some financial data; Google's stock price
r = (cbook.get_sample_data('goog.npz', np_load=True)['price_data']
     .view(np.recarray))
r = r[-250:]  # get the last 250 days

fig, ax = plt.subplots()
ax.plot(r.date, r.adj_close)

ax.xaxis.set_major_locator(dates.MonthLocator())
# 16 is a slight approximation since months differ in number of days.
ax.xaxis.set_minor_locator(dates.MonthLocator(bymonthday=16))

ax.xaxis.set_major_formatter(ticker.NullFormatter())
ax.xaxis.set_minor_formatter(dates.DateFormatter('%b'))

# Remove the tick lines
ax.tick_params(axis='x', which='minor', tick1On=False, tick2On=False)

# Align the minor tick label
for label in ax.get_xticklabels(minor=True):
    label.set_horizontalalignment('center')
imid = len(r) // 2
ax.set_xlabel(str(r.date[imid].item().year))
plt.show()