메모
전체 예제 코드를 다운로드 하려면 여기 를 클릭 하십시오.
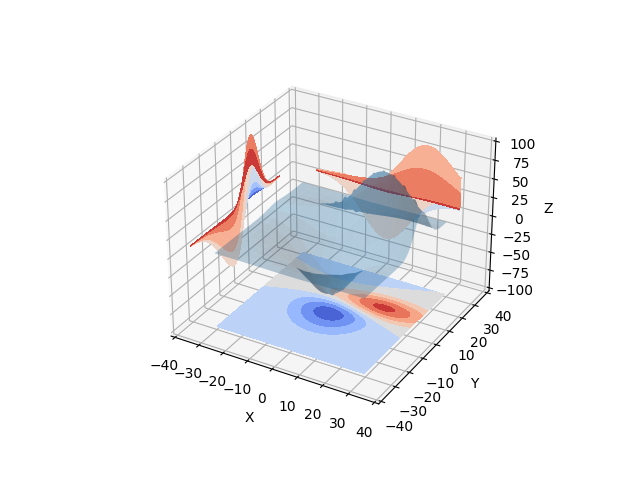
채워진 윤곽선을 그래프에 투영 #
채워진 윤곽선 '프로파일'을 그래프의 '벽'에 투영하면서 3D 표면을 표시하는 방법을 보여줍니다.
채워지지 않은 버전은 contour3d_demo2를 참조하십시오.
from mpl_toolkits.mplot3d import axes3d
import matplotlib.pyplot as plt
from matplotlib import cm

ax = plt.figure().add_subplot(projection='3d')
X, Y, Z = axes3d.get_test_data(0.05)

# Plot the 3D surface
ax.plot_surface(X, Y, Z, rstride=8, cstride=8, alpha=0.3)

# Plot projections of the contours for each dimension.  By choosing offsets
# that match the appropriate axes limits, the projected contours will sit on
# the 'walls' of the graph
ax.contourf(X, Y, Z, zdir='z', offset=-100, cmap=cm.coolwarm)
ax.contourf(X, Y, Z, zdir='x', offset=-40, cmap=cm.coolwarm)
ax.contourf(X, Y, Z, zdir='y', offset=40, cmap=cm.coolwarm)

ax.set(xlim=(-40, 40), ylim=(-40, 40), zlim=(-100, 100),
       xlabel='X', ylabel='Y', zlabel='Z')

plt.show()