메모
전체 예제 코드를 다운로드 하려면 여기 를 클릭 하십시오.
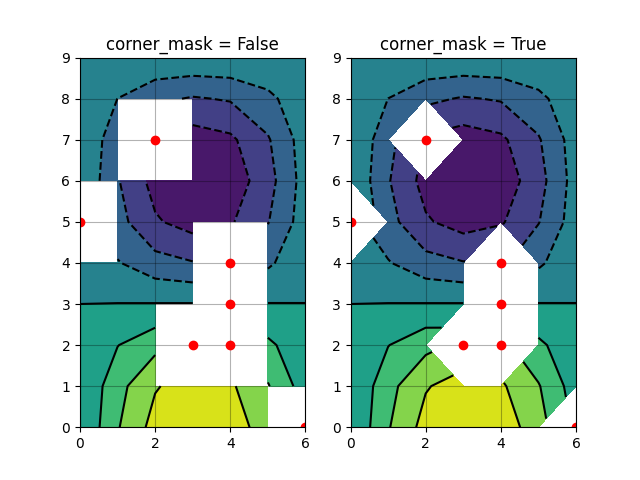
컨투어 코너 마스크 #
마스킹된 등고선 플롯 의 차이점을 설명합니다 corner_mask=False.
corner_mask=True
import matplotlib.pyplot as plt
import numpy as np

# Data to plot.
x, y = np.meshgrid(np.arange(7), np.arange(10))
z = np.sin(0.5 * x) * np.cos(0.52 * y)

# Mask various z values.
mask = np.zeros_like(z, dtype=bool)
mask[2, 3:5] = True
mask[3:5, 4] = True
mask[7, 2] = True
mask[5, 0] = True
mask[0, 6] = True
z = np.ma.array(z, mask=mask)

corner_masks = [False, True]
fig, axs = plt.subplots(ncols=2)
for ax, corner_mask in zip(axs, corner_masks):
    cs = ax.contourf(x, y, z, corner_mask=corner_mask)
    ax.contour(cs, colors='k')
    ax.set_title('corner_mask = {0}'.format(corner_mask))

    # Plot grid.
    ax.grid(c='k', ls='-', alpha=0.3)

    # Indicate masked points with red circles.
    ax.plot(np.ma.array(x, mask=~mask), y, 'ro')

plt.show()

참조
다음 함수, 메서드, 클래스 및 모듈의 사용이 이 예제에 표시됩니다.