메모
전체 예제 코드를 다운로드 하려면 여기 를 클릭 하십시오.
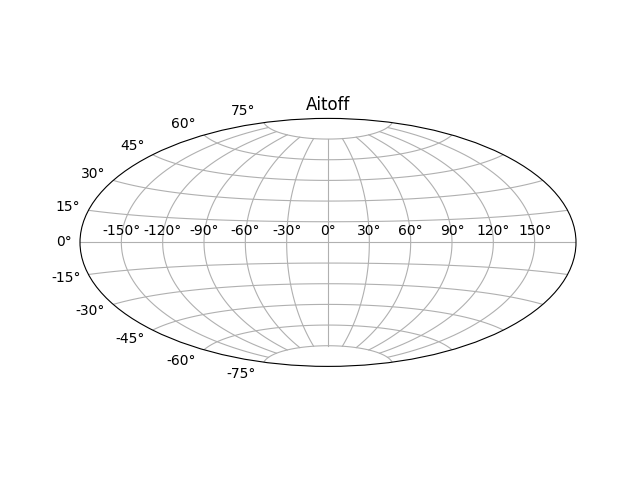
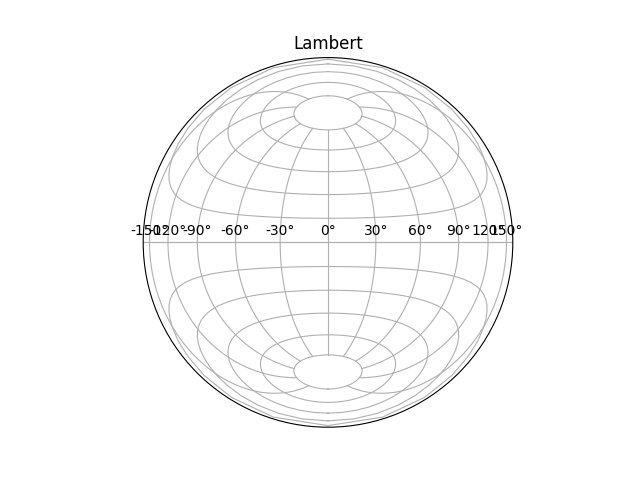
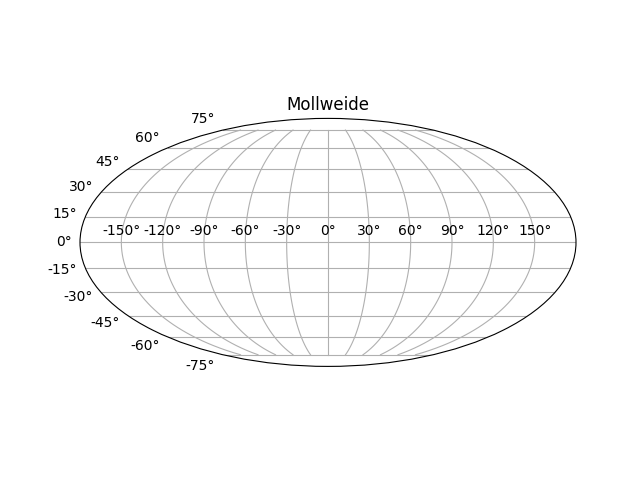
지리적 투영 #
이것은 4개의 가능한 지리적 투영을 보여줍니다. Cartopy 는 더 많은 프로젝션을 지원합니다.
import matplotlib.pyplot as plt
plt.figure()
plt.subplot(projection="aitoff")
plt.title("Aitoff")
plt.grid(True)
plt.figure()
plt.subplot(projection="hammer")
plt.title("Hammer")
plt.grid(True)

plt.figure()
plt.subplot(projection="lambert")
plt.title("Lambert")
plt.grid(True)
plt.figure()
plt.subplot(projection="mollweide")
plt.title("Mollweide")
plt.grid(True)

plt.show()
스크립트의 총 실행 시간: ( 0분 1.707초)