메모
전체 예제 코드를 다운로드 하려면 여기 를 클릭 하십시오.
Asinh 데모 #
asinh변환을 사용하는 축 스케일링 그림
\[a \rightarrow a_0 \sinh^{-1} (a / a_0)\]
0에 가까운 좌표 값의 경우(즉, "선형 폭"보다 훨씬 작음)\(a_0\)), 이렇게 하면 기본적으로 값이 변경되지 않습니다.
\[a \rightarrow a + \mathcal{O}(a^3)\]
그러나 더 큰 값(예:\(|a| \gg a_0\), 이것은 점근적으로
\[a \rightarrow a_0 \, \mathrm{sgn}(a) \ln |a| + \mathcal{O}(1)\]
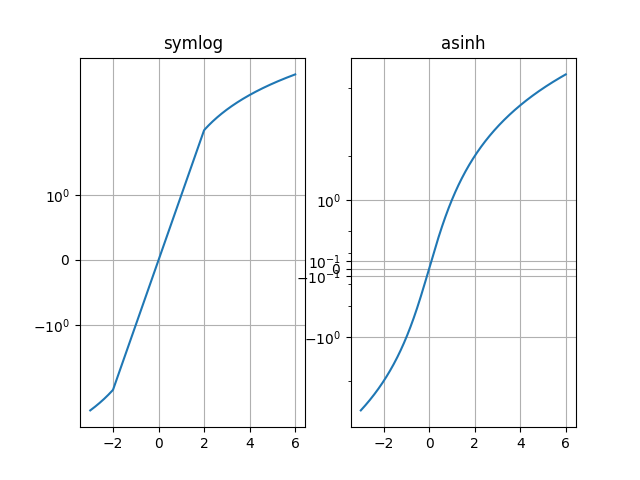
스케일링 과 마찬가지로 symlog이를 통해 양수 값과 음수 값을 모두 포함하는 매우 넓은 동적 범위를 포함하는 수량을 그릴 수 있습니다. 그러나 별도의 선형 변환과 대수 변환 symlog으로 구성되기 때문에 기울기에 불연속적인 변환이 포함됩니다 . 스케일링은 모든(유한) 값에 대해 매끄러운 변환을 사용합니다. 이 변환은 수학적으로 더 깨끗하고 플롯의 선형 영역과 대수 영역 사이의 급격한 전환과 관련된 시각적 아티팩트를 줄입니다 .asinh
메모
scale.AsinhScale실험적이며 API가 변경될 수 있습니다.
참조 하십시오 AsinhScale.SymmetricalLogScale
import numpy as np
import matplotlib.pyplot as plt

# Prepare sample values for variations on y=x graph:
x = np.linspace(-3, 6, 500)
샘플 y=x 그래프에서 "symlog" 및 "asinh" 동작을 비교하십시오. 여기에서 y=2 근처에서 "symlog"에 불연속 기울기가 있습니다.
fig1 = plt.figure()
ax0, ax1 = fig1.subplots(1, 2, sharex=True)

ax0.plot(x, x)
ax0.set_yscale('symlog')
ax0.grid()
ax0.set_title('symlog')

ax1.plot(x, x)
ax1.set_yscale('asinh')
ax1.grid()
ax1.set_title('asinh')

Text(0.5, 1.0, 'asinh')
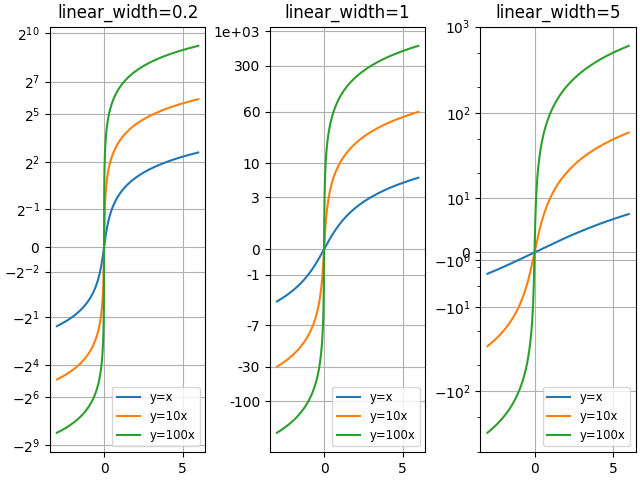
"asinh" 그래프를 다른 척도 매개변수 "linear_width"와 비교:
fig2 = plt.figure(constrained_layout=True)
axs = fig2.subplots(1, 3, sharex=True)
for ax, (a0, base) in zip(axs, ((0.2, 2), (1.0, 0), (5.0, 10))):
    ax.set_title('linear_width={:.3g}'.format(a0))
    ax.plot(x, x, label='y=x')
    ax.plot(x, 10*x, label='y=10x')
    ax.plot(x, 100*x, label='y=100x')
    ax.set_yscale('asinh', linear_width=a0, base=base)
    ax.grid()
    ax.legend(loc='best', fontsize='small')

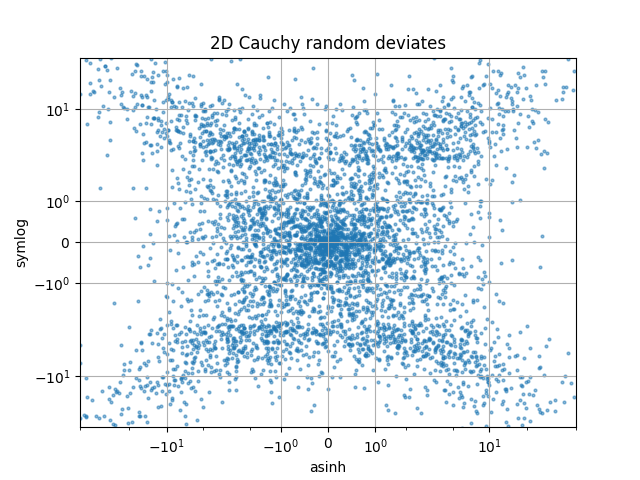
2D Cauchy 분포 난수에서 "symlog" 및 "asinh" 스케일링을 비교하면 "symlog"의 기울기 불연속성으로 인해 y=2 근처에서 더 미묘한 아티팩트를 볼 수 있습니다.
fig3 = plt.figure()
ax = fig3.subplots(1, 1)
r = 3 * np.tan(np.random.uniform(-np.pi / 2.02, np.pi / 2.02,
                                 size=(5000,)))
th = np.random.uniform(0, 2*np.pi, size=r.shape)

ax.scatter(r * np.cos(th), r * np.sin(th), s=4, alpha=0.5)
ax.set_xscale('asinh')
ax.set_yscale('symlog')
ax.set_xlabel('asinh')
ax.set_ylabel('symlog')
ax.set_title('2D Cauchy random deviates')
ax.set_xlim(-50, 50)
ax.set_ylim(-50, 50)
ax.grid()

plt.show()

스크립트의 총 실행 시간: (0분 2.229초)