메모
전체 예제 코드를 다운로드 하려면 여기 를 클릭 하십시오.
이벤트 데모 선택 #
아티스트의 "picker" 속성을 설정하여 선택을 활성화할 수 있습니다(예: Matplotlib Line2D, Text, Patch, Polygon, AxesImage 등).
picker 속성에는 다양한 의미가 있습니다.
없음 - 이 아티스트에 대해 피킹이 비활성화됨(기본값)
bool - True 이면 피킹이 활성화되고 마우스 이벤트가 아티스트 위에 있으면 아티스트가 pick 이벤트를 발생시킵니다.
설정
pickradius은 포인트에 엡실론 허용 오차를 추가하고 해당 데이터가 마우스 이벤트의 엡실론 내에 있는 경우 아티스트가 이벤트를 발생시킵니다. 라인 및 패치 컬렉션과 같은 일부 아티스트의 경우 아티스트는 생성된 선택 이벤트에 추가 데이터(예: 선택 이벤트의 엡실론 내 데이터 인덱스)를 제공할 수 있습니다.function - picker가 호출 가능한 경우 아티스트가 마우스 이벤트에 맞았는지 여부를 결정하는 사용자 제공 함수입니다.
hit, props = picker(artist, mouseevent)
적중 테스트를 결정합니다. 마우스 이벤트가 아티스트 위에 있으면 hit=True를 반환하고 props는 PickEvent 속성에 추가하려는 속성의 사전입니다.
"picker" 속성을 설정하여 아티스트의 피킹을 활성화한 후 그림 캔버스 pick_event에 연결하여 마우스 누르기 이벤트에 대한 콜백을 가져와야 합니다. 예를 들어,
def pick_handler(event):
    mouseevent = event.mouseevent
    artist = event.artist
    # now do something with this...
콜백에 전달되는 선택 이벤트(matplotlib.backend_bases.PickEvent)는 항상 두 가지 속성으로 시작됩니다.
- 마우스 이벤트
pick 이벤트를 생성하는 마우스 이벤트.
차례로 마우스 이벤트에는 x 및 y(왼쪽, 아래쪽의 픽셀과 같은 표시 공간의 좌표) 및 xdata, ydata(데이터 공간의 좌표)와 같은 속성이 있습니다. 또한 어떤 버튼을 눌렀는지, 어떤 키를 눌렀는지, 마우스가 어떤 축 위에 있는지 등에 대한 정보를 얻을 수 있습니다. 자세한 내용은 matplotlib.backend_bases.MouseEvent를 참조하십시오.
- 아티스트
pick 이벤트를 생성한 matplotlib.artist.
또한 Line2D 및 PatchCollection과 같은 특정 아티스트는 인덱스와 같은 추가 메타 데이터를 피커 기준(예: 지정된 엡실론 허용 오차 내에 있는 선의 모든 지점)을 충족하는 데이터에 첨부할 수 있습니다.
아래의 예는 이러한 각 방법을 보여줍니다.
메모
이 예제는 Matplotlib의 대화형 기능을 실행하며 정적 문서에는 나타나지 않습니다. 상호 작용을 보려면 컴퓨터에서 이 코드를 실행하십시오.
개별 부분을 복사하여 붙여넣거나 페이지 하단의 링크를 사용하여 전체 예제를 다운로드할 수 있습니다.
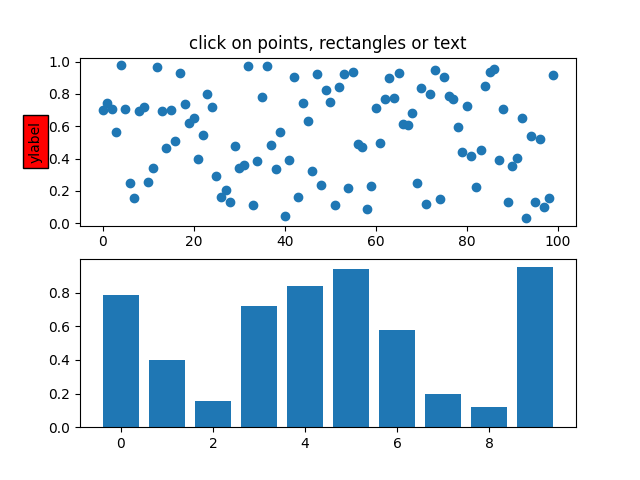
간단한 선택, 선, 사각형 및 텍스트 #
fig, (ax1, ax2) = plt.subplots(2, 1)
ax1.set_title('click on points, rectangles or text', picker=True)
ax1.set_ylabel('ylabel', picker=True, bbox=dict(facecolor='red'))
line, = ax1.plot(rand(100), 'o', picker=True, pickradius=5)

# Pick the rectangle.
ax2.bar(range(10), rand(10), picker=True)
for label in ax2.get_xticklabels():  # Make the xtick labels pickable.
    label.set_picker(True)


def onpick1(event):
    if isinstance(event.artist, Line2D):
        thisline = event.artist
        xdata = thisline.get_xdata()
        ydata = thisline.get_ydata()
        ind = event.ind
        print('onpick1 line:', np.column_stack([xdata[ind], ydata[ind]]))
    elif isinstance(event.artist, Rectangle):
        patch = event.artist
        print('onpick1 patch:', patch.get_path())
    elif isinstance(event.artist, Text):
        text = event.artist
        print('onpick1 text:', text.get_text())


fig.canvas.mpl_connect('pick_event', onpick1)
11
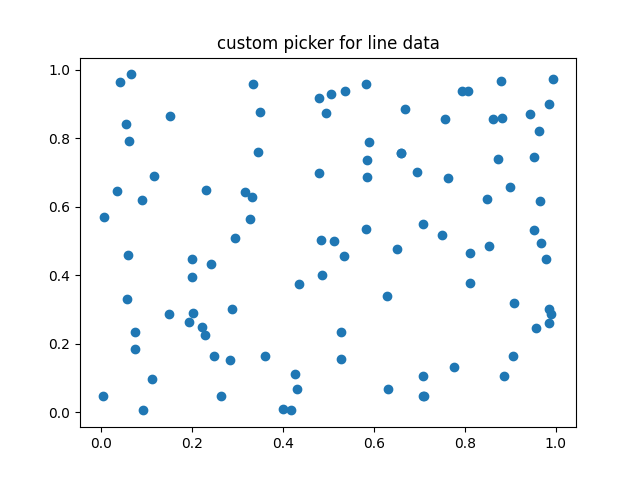
커스텀 적중 테스트 기능으로 피킹 #
선택기를 호출 가능한 함수로 설정하여 사용자 정의 선택기를 정의할 수 있습니다. 함수에는 서명이 있습니다.
hit, props = func(artist, mouseevent)
적중 테스트를 결정합니다. 마우스 이벤트가 아티스트 위에 있으면 반환
hit=True하고 속성 props에 추가하려는 속성의 사전입니다 PickEvent.
def line_picker(line, mouseevent):
    """
    Find the points within a certain distance from the mouseclick in
    data coords and attach some extra attributes, pickx and picky
    which are the data points that were picked.
    """
    if mouseevent.xdata is None:
        return False, dict()
    xdata = line.get_xdata()
    ydata = line.get_ydata()
    maxd = 0.05
    d = np.sqrt(
        (xdata - mouseevent.xdata)**2 + (ydata - mouseevent.ydata)**2)

    ind, = np.nonzero(d <= maxd)
    if len(ind):
        pickx = xdata[ind]
        picky = ydata[ind]
        props = dict(ind=ind, pickx=pickx, picky=picky)
        return True, props
    else:
        return False, dict()


def onpick2(event):
    print('onpick2 line:', event.pickx, event.picky)


fig, ax = plt.subplots()
ax.set_title('custom picker for line data')
line, = ax.plot(rand(100), rand(100), 'o', picker=line_picker)
fig.canvas.mpl_connect('pick_event', onpick2)
11
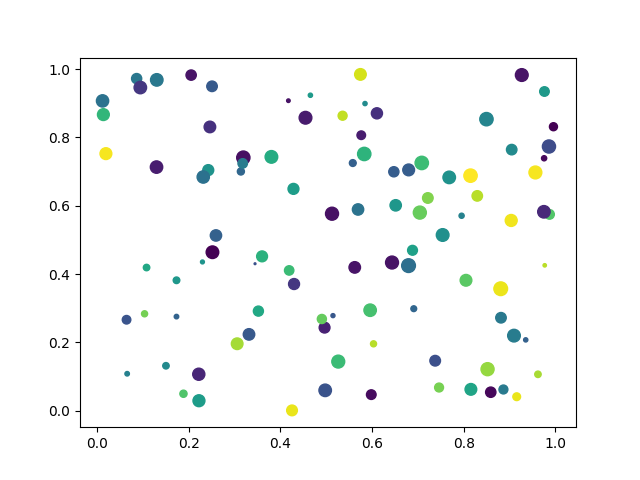
산점도 선택 #
산점도는 PathCollection.
x, y, c, s = rand(4, 100)


def onpick3(event):
    ind = event.ind
    print('onpick3 scatter:', ind, x[ind], y[ind])


fig, ax = plt.subplots()
ax.scatter(x, y, 100*s, c, picker=True)
fig.canvas.mpl_connect('pick_event', onpick3)
11
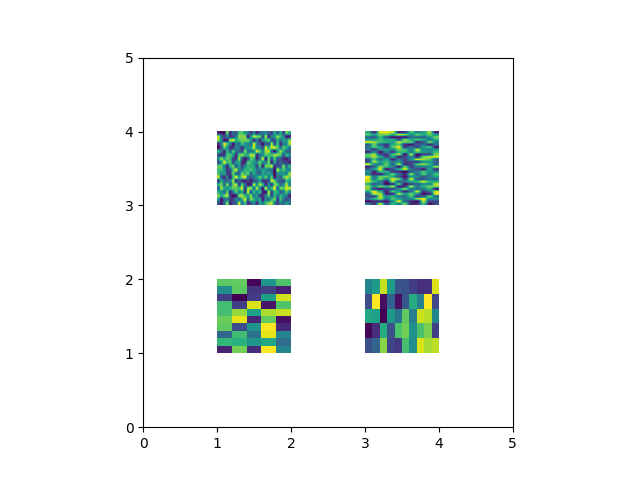
이미지 따기 #
를 사용하여 플롯된 이미지 Axes.imshow는 AxesImage
객체입니다.
fig, ax = plt.subplots()
ax.imshow(rand(10, 5), extent=(1, 2, 1, 2), picker=True)
ax.imshow(rand(5, 10), extent=(3, 4, 1, 2), picker=True)
ax.imshow(rand(20, 25), extent=(1, 2, 3, 4), picker=True)
ax.imshow(rand(30, 12), extent=(3, 4, 3, 4), picker=True)
ax.set(xlim=(0, 5), ylim=(0, 5))


def onpick4(event):
    artist = event.artist
    if isinstance(artist, AxesImage):
        im = artist
        A = im.get_array()
        print('onpick4 image', A.shape)


fig.canvas.mpl_connect('pick_event', onpick4)

plt.show()
스크립트의 총 실행 시간: (0분 1.456초)