메모
전체 예제 코드를 다운로드 하려면 여기 를 클릭 하십시오.
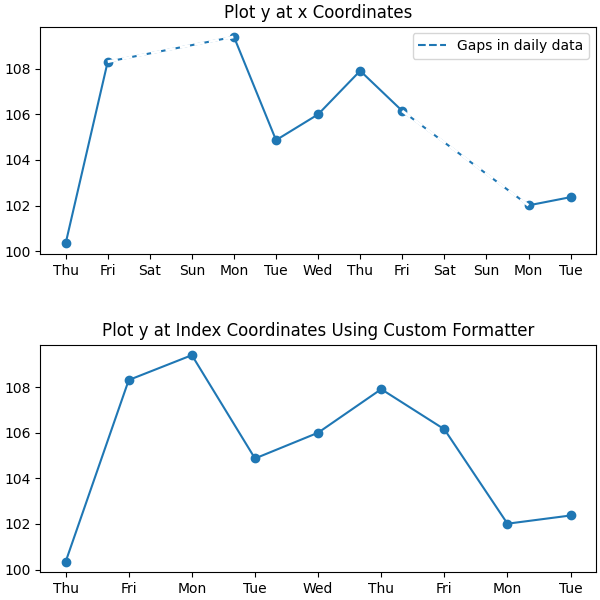
시계열에 대한 사용자 지정 눈금 포맷터 #
예를 들어 금융 시계열과 같은 일일 데이터를 플로팅할 때 데이터가 없는 날(예: 주말)을 생략하여 데이터가 없는 날에 대해 추가 공백 없이 일정한 간격으로 데이터를 플로팅하려는 경우가 많습니다. 예제는 원하는 플롯을 얻기 위해 '인덱스 포맷터'를 사용하는 방법을 보여줍니다.
import numpy as np
import matplotlib.pyplot as plt
import matplotlib.cbook as cbook
import matplotlib.lines as ml
from matplotlib.dates import DateFormatter, DayLocator
from matplotlib.ticker import Formatter


# Load a numpy record array from yahoo csv data with fields date, open, high,
# low, close, volume, adj_close from the mpl-data/sample_data directory. The
# record array stores the date as an np.datetime64 with a day unit ('D') in
# the date column (``r.date``).
r = (cbook.get_sample_data('goog.npz', np_load=True)['price_data']
     .view(np.recarray))
r = r[:9]  # get the first 9 days

fig, (ax1, ax2) = plt.subplots(nrows=2, figsize=(6, 6),
                               constrained_layout={'hspace': .15})

# First we'll do it the default way, with gaps on weekends
ax1.plot(r.date, r.adj_close, 'o-')

# Highlight gaps in daily data
gaps = np.flatnonzero(np.diff(r.date) > np.timedelta64(1, 'D'))
for gap in r[['date', 'adj_close']][np.stack((gaps, gaps + 1)).T]:
    ax1.plot(gap.date, gap.adj_close, 'w--', lw=2)
ax1.legend(handles=[ml.Line2D([], [], ls='--', label='Gaps in daily data')])

ax1.set_title("Plot y at x Coordinates")
ax1.xaxis.set_major_locator(DayLocator())
ax1.xaxis.set_major_formatter(DateFormatter('%a'))


# Next we'll write a custom index formatter. Below we will plot
# the data against an index that goes from 0, 1,  ... len(data).  Instead of
# formatting the tick marks as integers, we format as times.
def format_date(x, _):
    try:
        # convert datetime64 to datetime, and use datetime's strftime:
        return r.date[round(x)].item().strftime('%a')
    except IndexError:
        pass

# Create an index plot (x defaults to range(len(y)) if omitted)
ax2.plot(r.adj_close, 'o-')

ax2.set_title("Plot y at Index Coordinates Using Custom Formatter")
ax2.xaxis.set_major_formatter(format_date)  # internally creates FuncFormatter
함수를 전달하는 대신 Axis.set_major_formatter다른 콜러블을 사용할 수 있습니다(예: __call__을 구현하는 클래스의 인스턴스).
class MyFormatter(Formatter):
    def __init__(self, dates, fmt='%a'):
        self.dates = dates
        self.fmt = fmt

    def __call__(self, x, pos=0):
        """Return the label for time x at position pos."""
        try:
            return self.dates[round(x)].item().strftime(self.fmt)
        except IndexError:
            pass


ax2.xaxis.set_major_formatter(MyFormatter(r.date, '%a'))