메모
전체 예제 코드를 다운로드 하려면 여기 를 클릭 하십시오.
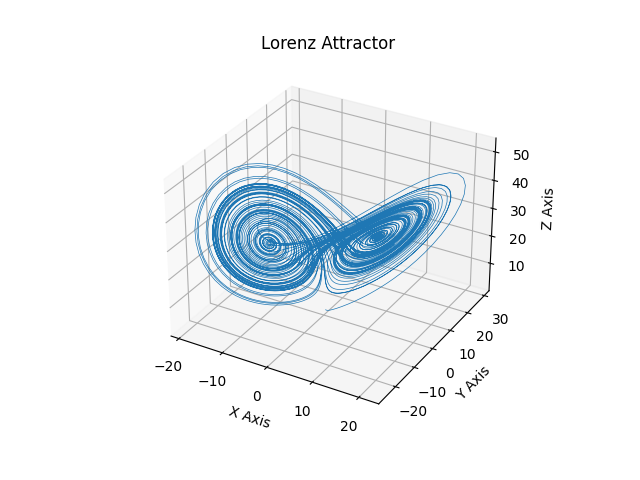
로렌츠 어트랙터 #
이것은 Edward Lorenz의 1963년 "Deterministic Nonperiodic Flow" 를 mplot3d를 사용하여 3차원 공간에 플로팅한 예입니다.
메모
이것은 단순한 비선형 ODE이기 때문에 SciPy의 ODE 솔버를 사용하면 더 쉽게 수행할 수 있지만 이 접근 방식은 NumPy에만 의존합니다.
import numpy as np
import matplotlib.pyplot as plt


def lorenz(xyz, *, s=10, r=28, b=2.667):
    """
    Parameters
    ----------
    xyz : array-like, shape (3,)
       Point of interest in three dimensional space.
    s, r, b : float
       Parameters defining the Lorenz attractor.

    Returns
    -------
    xyz_dot : array, shape (3,)
       Values of the Lorenz attractor's partial derivatives at *xyz*.
    """
    x, y, z = xyz
    x_dot = s*(y - x)
    y_dot = r*x - y - x*z
    z_dot = x*y - b*z
    return np.array([x_dot, y_dot, z_dot])


dt = 0.01
num_steps = 10000

xyzs = np.empty((num_steps + 1, 3))  # Need one more for the initial values
xyzs[0] = (0., 1., 1.05)  # Set initial values
# Step through "time", calculating the partial derivatives at the current point
# and using them to estimate the next point
for i in range(num_steps):
    xyzs[i + 1] = xyzs[i] + lorenz(xyzs[i]) * dt

# Plot
ax = plt.figure().add_subplot(projection='3d')

ax.plot(*xyzs.T, lw=0.5)
ax.set_xlabel("X Axis")
ax.set_ylabel("Y Axis")
ax.set_zlabel("Z Axis")
ax.set_title("Lorenz Attractor")

plt.show()