메모
전체 예제 코드를 다운로드 하려면 여기 를 클릭 하십시오.
ConciseDateFormatter를 사용하여 날짜 눈금 서식 지정 #
좋은 눈금 값을 찾고 날짜 데이터가 있는 축의 눈금 서식을 지정하는 것은 어려운 경우가 많습니다. ConciseDateFormatterticklabels에 대해 선택된 문자열을 개선하고 해당 눈금 레이블에 사용되는 문자열을 가능한 한 최소화하기 위한 것입니다.
메모
이 포맷터는 Matplotlib의 향후 버전에서 기본 날짜 눈금 포맷터가 될 후보입니다. 문제가 있거나 개선을 위한 제안 사항이 있으면 github 저장소 또는 메일링 리스트에 보고해 주세요.
import datetime
import matplotlib.pyplot as plt
import matplotlib.dates as mdates
import numpy as np
먼저 기본 포맷터입니다.
base = datetime.datetime(2005, 2, 1)
dates = [base + datetime.timedelta(hours=(2 * i)) for i in range(732)]
N = len(dates)
np.random.seed(19680801)
y = np.cumsum(np.random.randn(N))

fig, axs = plt.subplots(3, 1, constrained_layout=True, figsize=(6, 6))
lims = [(np.datetime64('2005-02'), np.datetime64('2005-04')),
        (np.datetime64('2005-02-03'), np.datetime64('2005-02-15')),
        (np.datetime64('2005-02-03 11:00'), np.datetime64('2005-02-04 13:20'))]
for nn, ax in enumerate(axs):
    ax.plot(dates, y)
    ax.set_xlim(lims[nn])
    # rotate_labels...
    for label in ax.get_xticklabels():
        label.set_rotation(40)
        label.set_horizontalalignment('right')
axs[0].set_title('Default Date Formatter')
plt.show()
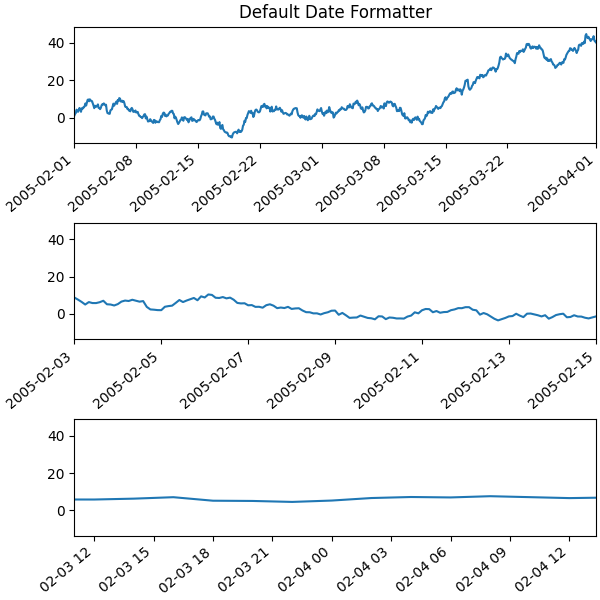
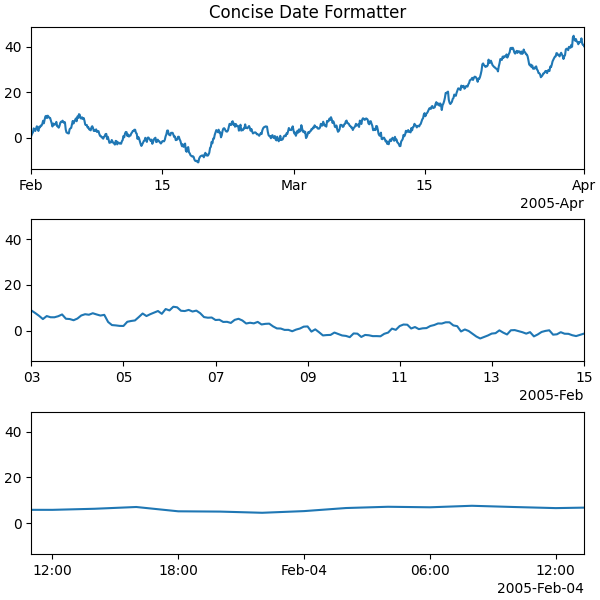
기본 날짜 포맷터는 매우 장황하므로 ConciseDateFormatter아래와 같이 를 사용할 수 있습니다. 이 예에서는 레이블이 가능한 작기 때문에 기본 포맷터에서와 같이 레이블을 회전할 필요가 없습니다.
fig, axs = plt.subplots(3, 1, constrained_layout=True, figsize=(6, 6))
for nn, ax in enumerate(axs):
    locator = mdates.AutoDateLocator(minticks=3, maxticks=7)
    formatter = mdates.ConciseDateFormatter(locator)
    ax.xaxis.set_major_locator(locator)
    ax.xaxis.set_major_formatter(formatter)

    ax.plot(dates, y)
    ax.set_xlim(lims[nn])
axs[0].set_title('Concise Date Formatter')

plt.show()
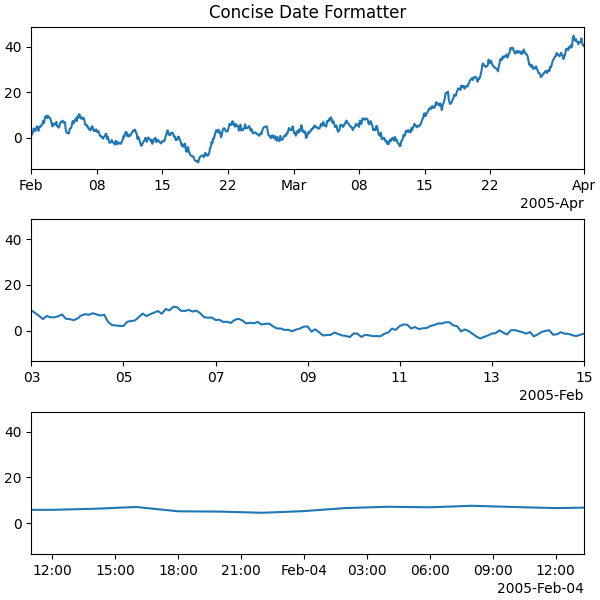
날짜가 있는 축에 대한 모든 호출이 이 변환기를 사용하여 수행되는 경우 가져오기를 수행하는 단위 레지스트리를 사용하는 것이 아마도 가장 편리할 것입니다.
import matplotlib.units as munits
converter = mdates.ConciseDateConverter()
munits.registry[np.datetime64] = converter
munits.registry[datetime.date] = converter
munits.registry[datetime.datetime] = converter

fig, axs = plt.subplots(3, 1, figsize=(6, 6), constrained_layout=True)
for nn, ax in enumerate(axs):
    ax.plot(dates, y)
    ax.set_xlim(lims[nn])
axs[0].set_title('Concise Date Formatter')

plt.show()
날짜 형식의 현지화 #
세 가지 문자열 목록 중 하나를 조작하여 기본 형식이 바람직하지 않은 경우 날짜 형식을 지역화할 수 있습니다.
형식 목록 은 formatter.formats일반 눈금 레이블에 대한 것입니다. 년, 월, 일, 시, 분, 초의 6개 수준이 있습니다. formatter.offset_formats축 오른쪽에 있는 "오프셋" 문자열의 형식이 지정되는 방식입니다 . 이것은 일반적으로 눈금 레이블보다 훨씬 더 장황합니다. 마지막으로 formatter.zero_formats"0"인 틱의 형식입니다. 이들은 연도, 월 또는 일의 첫 번째 또는 0번째 시, 분 또는 초인 눈금 값입니다. 이들은 일반적으로 한 수준 위의 틱 형식과 동일합니다. 예를 들어 축 제한이 틱이 대부분 일임을 의미하는 경우 2005년 3월 1일에 단순히 "3월"로 레이블을 지정합니다. 축 제한이 대부분 시간인 경우 2월 4일 00:00을 단순히 "2월 4일"로 표시합니다.
이러한 형식 목록은 ConciseDateFormatter
선택적 키워드 인수로 전달될 수도 있습니다.
여기서 레이블을 ISO "년 월 일" 대신 "일 월 연도"로 수정합니다.
fig, axs = plt.subplots(3, 1, constrained_layout=True, figsize=(6, 6))

for nn, ax in enumerate(axs):
    locator = mdates.AutoDateLocator()
    formatter = mdates.ConciseDateFormatter(locator)
    formatter.formats = ['%y',  # ticks are mostly years
                         '%b',       # ticks are mostly months
                         '%d',       # ticks are mostly days
                         '%H:%M',    # hrs
                         '%H:%M',    # min
                         '%S.%f', ]  # secs
    # these are mostly just the level above...
    formatter.zero_formats = [''] + formatter.formats[:-1]
    # ...except for ticks that are mostly hours, then it is nice to have
    # month-day:
    formatter.zero_formats[3] = '%d-%b'

    formatter.offset_formats = ['',
                                '%Y',
                                '%b %Y',
                                '%d %b %Y',
                                '%d %b %Y',
                                '%d %b %Y %H:%M', ]
    ax.xaxis.set_major_locator(locator)
    ax.xaxis.set_major_formatter(formatter)

    ax.plot(dates, y)
    ax.set_xlim(lims[nn])
axs[0].set_title('Concise Date Formatter')

plt.show()

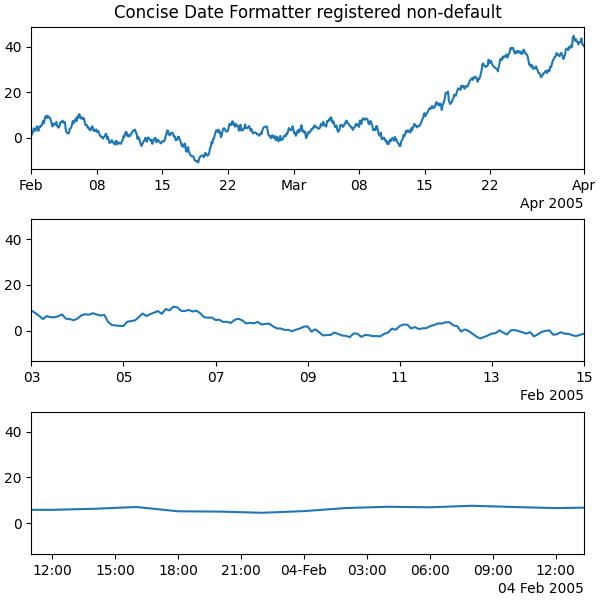
현지화로 변환기 등록 #
ConciseDateFormatterrcParams 항목이 없지만 키워드 인수를 전달 ConciseDateConverter하고 단위 레지스트리와 함께 사용할 데이터 유형을 등록하여 현지화를 수행할 수 있습니다.
import datetime

formats = ['%y',          # ticks are mostly years
           '%b',     # ticks are mostly months
           '%d',     # ticks are mostly days
           '%H:%M',  # hrs
           '%H:%M',  # min
           '%S.%f', ]  # secs
# these can be the same, except offset by one level....
zero_formats = [''] + formats[:-1]
# ...except for ticks that are mostly hours, then its nice to have month-day
zero_formats[3] = '%d-%b'
offset_formats = ['',
                  '%Y',
                  '%b %Y',
                  '%d %b %Y',
                  '%d %b %Y',
                  '%d %b %Y %H:%M', ]

converter = mdates.ConciseDateConverter(
    formats=formats, zero_formats=zero_formats, offset_formats=offset_formats)

munits.registry[np.datetime64] = converter
munits.registry[datetime.date] = converter
munits.registry[datetime.datetime] = converter

fig, axs = plt.subplots(3, 1, constrained_layout=True, figsize=(6, 6))
for nn, ax in enumerate(axs):
    ax.plot(dates, y)
    ax.set_xlim(lims[nn])
axs[0].set_title('Concise Date Formatter registered non-default')

plt.show()
스크립트의 총 실행 시간: ( 0분 3.859초)