메모
전체 예제 코드를 다운로드 하려면 여기 를 클릭 하십시오.
고급 quiver 및 quiverkey 기능 #
에 대한 몇 가지 고급 옵션을 보여줍니다 quiver. 간단한 예는 Quiver 단순 데모 를 참조하십시오 .
참고: 플롯 자동 크기 조정은 화살표를 고려하지 않으므로 경계에 있는 화살표가 그림 밖으로 나올 수 있습니다. 이것은 완벽하게 일반적인 방법으로 해결하기 쉬운 문제가 아닙니다. 권장되는 해결 방법은 이러한 경우 축 제한을 수동으로 설정하는 것입니다.
fig1, ax1 = plt.subplots()
ax1.set_title('Arrows scale with plot width, not view')
Q = ax1.quiver(X, Y, U, V, units='width')
qk = ax1.quiverkey(Q, 0.9, 0.9, 2, r'$2 \frac{m}{s}$', labelpos='E',
                   coordinates='figure')
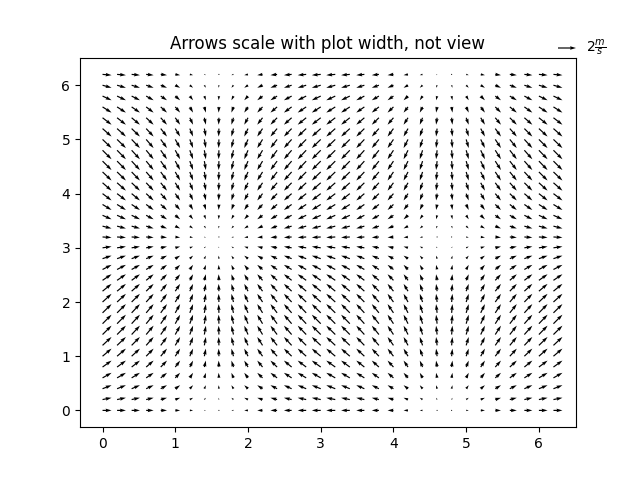
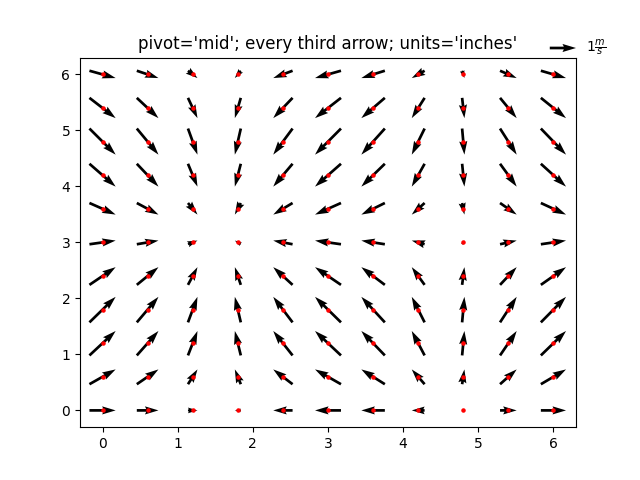
fig2, ax2 = plt.subplots()
ax2.set_title("pivot='mid'; every third arrow; units='inches'")
Q = ax2.quiver(X[::3, ::3], Y[::3, ::3], U[::3, ::3], V[::3, ::3],
               pivot='mid', units='inches')
qk = ax2.quiverkey(Q, 0.9, 0.9, 1, r'$1 \frac{m}{s}$', labelpos='E',
                   coordinates='figure')
ax2.scatter(X[::3, ::3], Y[::3, ::3], color='r', s=5)
<matplotlib.collections.PathCollection object at 0x7f2cfad10ac0>
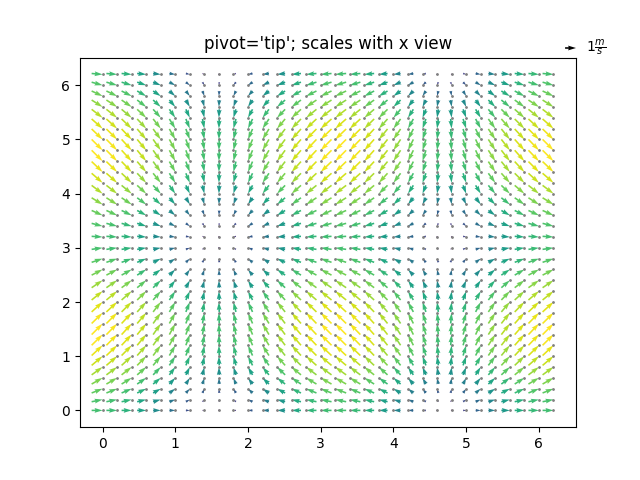
fig3, ax3 = plt.subplots()
ax3.set_title("pivot='tip'; scales with x view")
M = np.hypot(U, V)
Q = ax3.quiver(X, Y, U, V, M, units='x', pivot='tip', width=0.022,
               scale=1 / 0.15)
qk = ax3.quiverkey(Q, 0.9, 0.9, 1, r'$1 \frac{m}{s}$', labelpos='E',
                   coordinates='figure')
ax3.scatter(X, Y, color='0.5', s=1)

plt.show()
참조
다음 함수, 메서드, 클래스 및 모듈의 사용이 이 예제에 표시됩니다.
스크립트의 총 실행 시간: ( 0분 1.864초)