메모
전체 예제 코드를 다운로드 하려면 여기 를 클릭 하십시오.
시계열 히스토그램 #
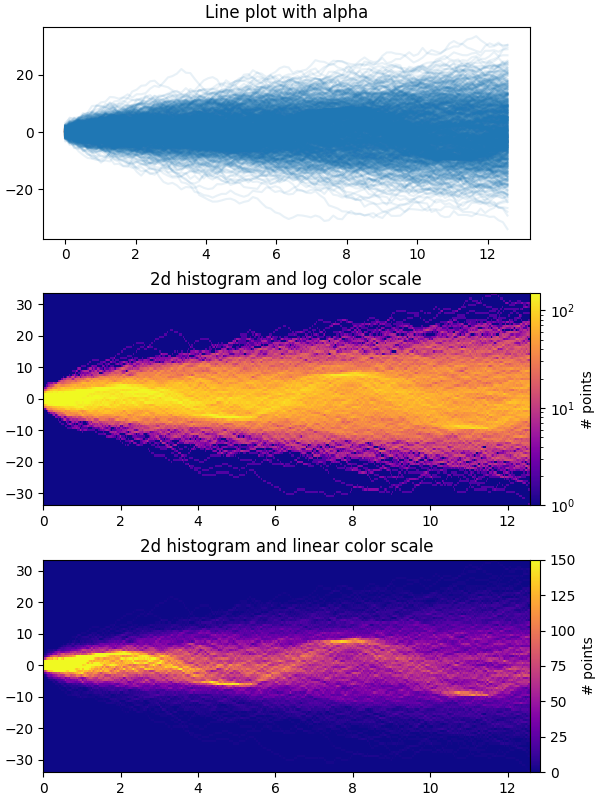
이 예제는 즉시 명확하지 않은 숨겨진 하위 구조와 패턴을 잠재적으로 드러내고 시각적으로 매력적인 방식으로 표시할 수 있는 방식으로 많은 수의 시계열을 효율적으로 시각화하는 방법을 보여줍니다.
이 예제에서는 더 많은 수의 랜덤 워크 "잡음/배경" 시리즈 아래에 묻혀 있는 여러 정현파 "신호" 시리즈를 생성합니다. 표준 편차가 σ인 편향되지 않은 가우시안 랜덤 워크의 경우 n 단계 후 원점으로부터의 RMS 편차는 σ*sqrt(n)입니다. 따라서 랜덤 워크와 동일한 스케일로 정현파를 표시하기 위해 랜덤 워크 RMS로 진폭을 스케일링합니다. 또한 phi
사인을 왼쪽/오른쪽으로 이동하는 작은 임의 오프셋과 개별 데이터 포인트를 위/아래로 이동하여 신호를 좀 더 "현실적"으로 만드는 추가 임의 노이즈도 도입합니다(완벽한 사인을 기대하지는 않습니다). 웨이브가 데이터에 나타납니다).
plt.plot첫 번째 플롯은 여러 시계열을 작은 값으로
서로 겹쳐서 시각화하는 일반적인 방법을 보여줍니다 alpha. np.histogram2d두 번째 및 세 번째 플롯은 및 를 사용하여 데이터 포인트 사이에 선택적 보간을 사용하여 데이터를 2d 히스토그램으로 재해석하는 방법을 보여줍니다
plt.pcolormesh.
from copy import copy
import time

import numpy as np
import numpy.matlib
import matplotlib.pyplot as plt
from matplotlib.colors import LogNorm

fig, axes = plt.subplots(nrows=3, figsize=(6, 8), constrained_layout=True)

# Make some data; a 1D random walk + small fraction of sine waves
num_series = 1000
num_points = 100
SNR = 0.10  # Signal to Noise Ratio
x = np.linspace(0, 4 * np.pi, num_points)
# Generate unbiased Gaussian random walks
Y = np.cumsum(np.random.randn(num_series, num_points), axis=-1)
# Generate sinusoidal signals
num_signal = int(round(SNR * num_series))
phi = (np.pi / 8) * np.random.randn(num_signal, 1)  # small random offset
Y[-num_signal:] = (
    np.sqrt(np.arange(num_points))[None, :]  # random walk RMS scaling factor
    * (np.sin(x[None, :] - phi)
       + 0.05 * np.random.randn(num_signal, num_points))  # small random noise
)


# Plot series using `plot` and a small value of `alpha`. With this view it is
# very difficult to observe the sinusoidal behavior because of how many
# overlapping series there are. It also takes a bit of time to run because so
# many individual artists need to be generated.
tic = time.time()
axes[0].plot(x, Y.T, color="C0", alpha=0.1)
toc = time.time()
axes[0].set_title("Line plot with alpha")
print(f"{toc-tic:.3f} sec. elapsed")


# Now we will convert the multiple time series into a histogram. Not only will
# the hidden signal be more visible, but it is also a much quicker procedure.
tic = time.time()
# Linearly interpolate between the points in each time series
num_fine = 800
x_fine = np.linspace(x.min(), x.max(), num_fine)
y_fine = np.empty((num_series, num_fine), dtype=float)
for i in range(num_series):
    y_fine[i, :] = np.interp(x_fine, x, Y[i, :])
y_fine = y_fine.flatten()
x_fine = np.matlib.repmat(x_fine, num_series, 1).flatten()


# Plot (x, y) points in 2d histogram with log colorscale
# It is pretty evident that there is some kind of structure under the noise
# You can tune vmax to make signal more visible
cmap = copy(plt.cm.plasma)
cmap.set_bad(cmap(0))
h, xedges, yedges = np.histogram2d(x_fine, y_fine, bins=[400, 100])
pcm = axes[1].pcolormesh(xedges, yedges, h.T, cmap=cmap,
                         norm=LogNorm(vmax=1.5e2), rasterized=True)
fig.colorbar(pcm, ax=axes[1], label="# points", pad=0)
axes[1].set_title("2d histogram and log color scale")

# Same data but on linear color scale
pcm = axes[2].pcolormesh(xedges, yedges, h.T, cmap=cmap,
                         vmax=1.5e2, rasterized=True)
fig.colorbar(pcm, ax=axes[2], label="# points", pad=0)
axes[2].set_title("2d histogram and linear color scale")

toc = time.time()
print(f"{toc-tic:.3f} sec. elapsed")
plt.show()

0.219 sec. elapsed
0.071 sec. elapsed
참조
다음 함수, 메서드, 클래스 및 모듈의 사용이 이 예제에 표시됩니다.
스크립트의 총 실행 시간: ( 0분 2.659초)