메모
전체 예제 코드를 다운로드 하려면 여기 를 클릭 하십시오.
수동 윤곽 #
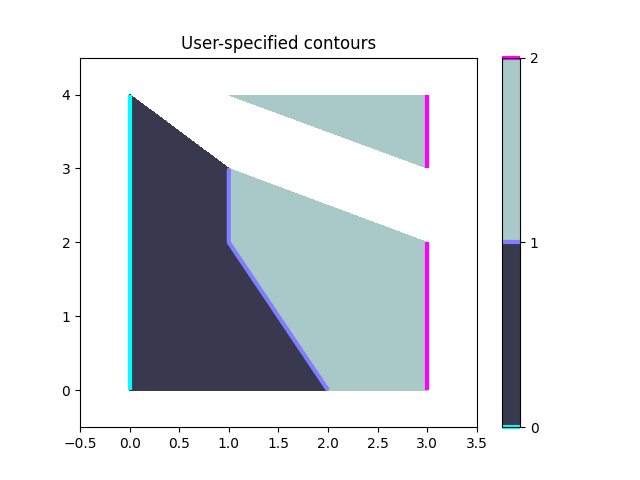
ContourSet을 사용하여 고유한 등고선과 다각형을 표시하는 예입니다.
import matplotlib.pyplot as plt
from matplotlib.contour import ContourSet
import matplotlib.cm as cm
각 레벨의 등고선은 폴리곤의 리스트/튜플입니다.
두 수준 사이의 채워진 윤곽선도 다각형의 목록/튜플입니다. 포인트는 시계 방향 또는 시계 반대 방향으로 주문할 수 있습니다.
fig, ax = plt.subplots()

# Filled contours using filled=True.
cs = ContourSet(ax, [0, 1, 2], [filled01, filled12], filled=True, cmap=cm.bone)
cbar = fig.colorbar(cs)

# Contour lines (non-filled).
lines = ContourSet(
    ax, [0, 1, 2], [lines0, lines1, lines2], cmap=cm.cool, linewidths=3)
cbar.add_lines(lines)

ax.set(xlim=(-0.5, 3.5), ylim=(-0.5, 4.5),
       title='User-specified contours')

[(-0.5, 3.5), (-0.5, 4.5), Text(0.5, 1.0, 'User-specified contours')]
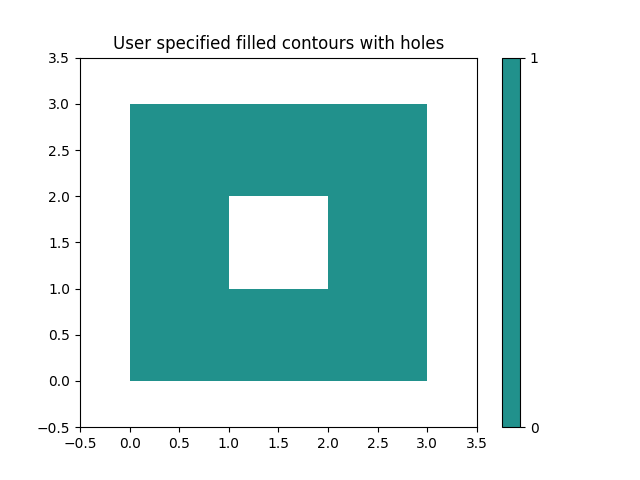
Path 클래스에 설명된 대로 정점 종류(코드 유형) 목록과 함께 다각형 정점의 단일 목록에 여러 개의 채워진 등고선을 지정할 수 있습니다. 구멍이 있는 다각형에 특히 유용합니다. 여기서 코드 유형 1은 MOVETO이고 2는 LINETO입니다.
fig, ax = plt.subplots()
filled01 = [[[0, 0], [3, 0], [3, 3], [0, 3], [1, 1], [1, 2], [2, 2], [2, 1]]]
kinds01 = [[1, 2, 2, 2, 1, 2, 2, 2]]
cs = ContourSet(ax, [0, 1], [filled01], [kinds01], filled=True)
cbar = fig.colorbar(cs)

ax.set(xlim=(-0.5, 3.5), ylim=(-0.5, 3.5),
       title='User specified filled contours with holes')

plt.show()
