메모
전체 예제 코드를 다운로드 하려면 여기 를 클릭 하십시오.
이벤트 데모 선택2 #
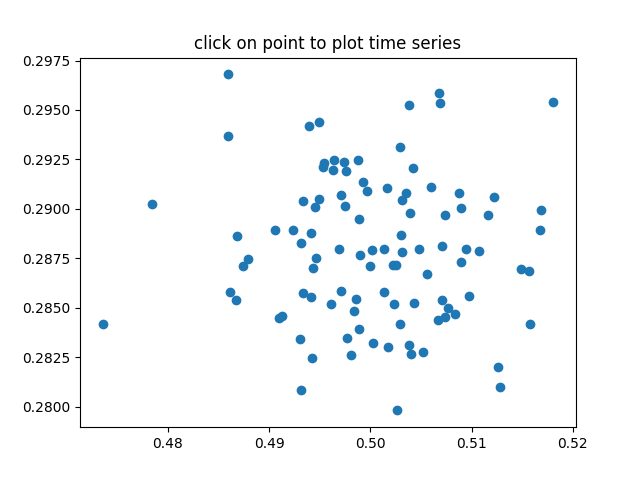
100개 데이터 세트의 평균(mu) 및 표준 편차(시그마)를 계산하고 mu 대 시그마를 플로팅합니다. (mu, sigma) 포인트 중 하나를 클릭하면 이 포인트를 생성한 데이터 세트의 원시 데이터를 플로팅합니다.
메모
이 예제는 Matplotlib의 대화형 기능을 실행하며 정적 문서에는 나타나지 않습니다. 상호 작용을 보려면 컴퓨터에서 이 코드를 실행하십시오.
개별 부분을 복사하여 붙여넣거나 페이지 하단의 링크를 사용하여 전체 예제를 다운로드할 수 있습니다.

import numpy as np
import matplotlib.pyplot as plt


# Fixing random state for reproducibility
np.random.seed(19680801)

X = np.random.rand(100, 1000)
xs = np.mean(X, axis=1)
ys = np.std(X, axis=1)

fig, ax = plt.subplots()
ax.set_title('click on point to plot time series')
line, = ax.plot(xs, ys, 'o', picker=True, pickradius=5)


def onpick(event):

    if event.artist != line:
        return

    N = len(event.ind)
    if not N:
        return

    figi, axs = plt.subplots(N, squeeze=False)
    for ax, dataind in zip(axs.flat, event.ind):
        ax.plot(X[dataind])
        ax.text(.05, .9, 'mu=%1.3f\nsigma=%1.3f' % (xs[dataind], ys[dataind]),
                transform=ax.transAxes, va='top')
        ax.set_ylim(-0.5, 1.5)
    figi.show()


fig.canvas.mpl_connect('pick_event', onpick)

plt.show()