메모
전체 예제 코드를 다운로드 하려면 여기 를 클릭 하십시오.
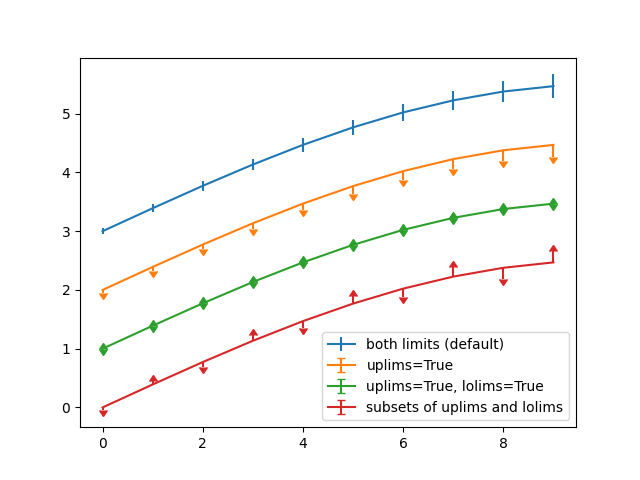
Errorbar 제한 선택 #
의 매개변수 uplims를 사용하여 오차 막대에 하한 및/또는 상한 기호를 선택적으로 그리는 그림 .lolimserrorbar
또는 2xN 값을 사용하여 한 방향으로만 오차 막대를 그릴 수 있습니다.
import numpy as np
import matplotlib.pyplot as plt


fig = plt.figure()
x = np.arange(10)
y = 2.5 * np.sin(x / 20 * np.pi)
yerr = np.linspace(0.05, 0.2, 10)

plt.errorbar(x, y + 3, yerr=yerr, label='both limits (default)')

plt.errorbar(x, y + 2, yerr=yerr, uplims=True, label='uplims=True')

plt.errorbar(x, y + 1, yerr=yerr, uplims=True, lolims=True,
             label='uplims=True, lolims=True')

upperlimits = [True, False] * 5
lowerlimits = [False, True] * 5
plt.errorbar(x, y, yerr=yerr, uplims=upperlimits, lolims=lowerlimits,
             label='subsets of uplims and lolims')

plt.legend(loc='lower right')
<matplotlib.legend.Legend object at 0x7f2d014dd390>
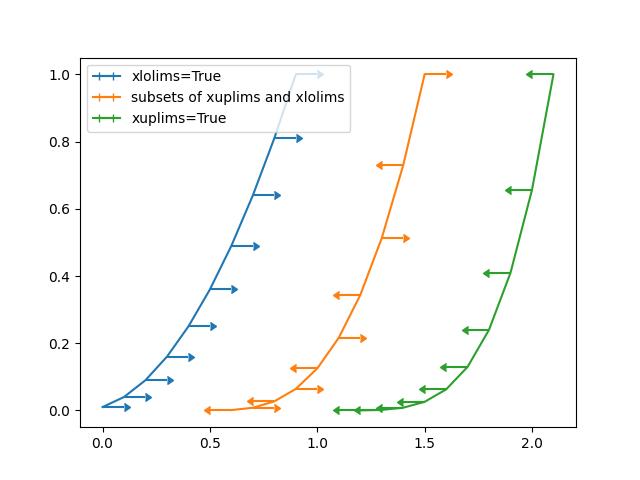
유사하게 xuplims가로 xlolims오차 막대에서 사용할 수 있습니다 xerr
.
fig = plt.figure()
x = np.arange(10) / 10
y = (x + 0.1)**2

plt.errorbar(x, y, xerr=0.1, xlolims=True, label='xlolims=True')
y = (x + 0.1)**3

plt.errorbar(x + 0.6, y, xerr=0.1, xuplims=upperlimits, xlolims=lowerlimits,
             label='subsets of xuplims and xlolims')

y = (x + 0.1)**4
plt.errorbar(x + 1.2, y, xerr=0.1, xuplims=True, label='xuplims=True')

plt.legend()
plt.show()