메모
전체 예제 코드를 다운로드 하려면 여기 를 클릭 하십시오.
보조 축 #
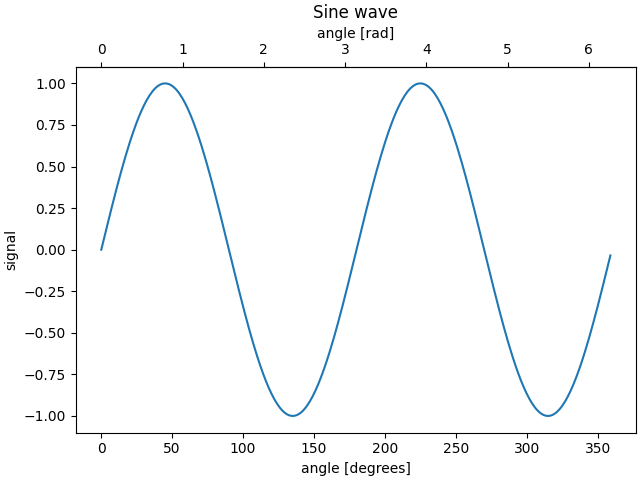
예를 들어 동일한 플롯에서 라디안을 각도로 변환하기 위해 플롯에 보조 축이 필요한 경우가 있습니다. axes.Axes.secondary_xaxis및
를 통해 하나의 축만 표시되는 자식 축을 만들어 이를 수행할 수 있습니다 axes.Axes.secondary_yaxis. 이 보조 축은 functions 키워드 인수 에 대한 튜플로 정방향 및 역방향 변환 함수를 모두 제공하여 기본 축과 다른 스케일을 가질 수 있습니다 .
import matplotlib.pyplot as plt
import numpy as np
import datetime
import matplotlib.dates as mdates
from matplotlib.ticker import AutoMinorLocator

fig, ax = plt.subplots(constrained_layout=True)
x = np.arange(0, 360, 1)
y = np.sin(2 * x * np.pi / 180)
ax.plot(x, y)
ax.set_xlabel('angle [degrees]')
ax.set_ylabel('signal')
ax.set_title('Sine wave')


def deg2rad(x):
    return x * np.pi / 180


def rad2deg(x):
    return x * 180 / np.pi


secax = ax.secondary_xaxis('top', functions=(deg2rad, rad2deg))
secax.set_xlabel('angle [rad]')
plt.show()

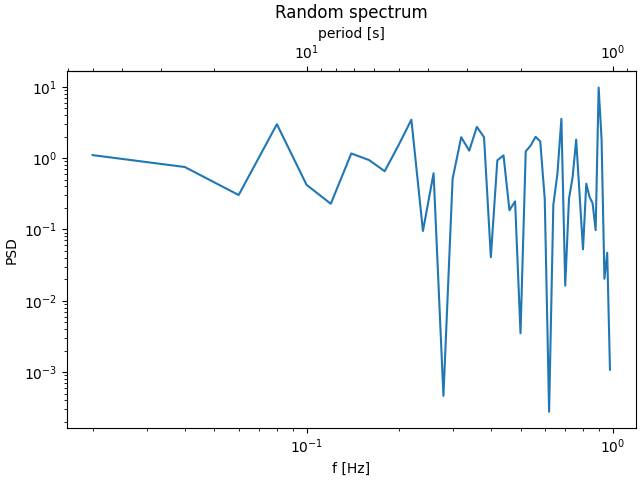
다음은 로그-로그 스케일에서 파수에서 파장으로 변환한 경우입니다.
메모
이 경우 부모의 xscale은 대수이므로 자식도 대수로 만듭니다.
fig, ax = plt.subplots(constrained_layout=True)
x = np.arange(0.02, 1, 0.02)
np.random.seed(19680801)
y = np.random.randn(len(x)) ** 2
ax.loglog(x, y)
ax.set_xlabel('f [Hz]')
ax.set_ylabel('PSD')
ax.set_title('Random spectrum')


def one_over(x):
    """Vectorized 1/x, treating x==0 manually"""
    x = np.array(x).astype(float)
    near_zero = np.isclose(x, 0)
    x[near_zero] = np.inf
    x[~near_zero] = 1 / x[~near_zero]
    return x


# the function "1/x" is its own inverse
inverse = one_over


secax = ax.secondary_xaxis('top', functions=(one_over, inverse))
secax.set_xlabel('period [s]')
plt.show()

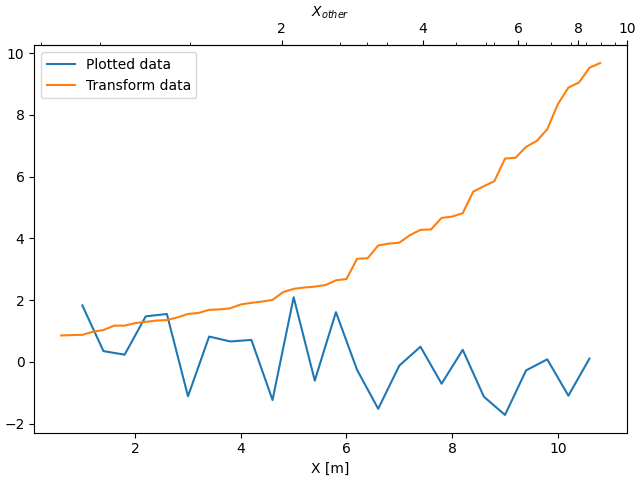
때때로 우리는 데이터에서 임시이고 경험적으로 파생된 변환에서 축을 연관시키고자 합니다. 이 경우 순방향 및 역변환 함수를 한 데이터 세트에서 다른 데이터 세트로의 선형 보간으로 설정할 수 있습니다.
메모
데이터 마진을 적절하게 처리하려면 매핑 함수( forward및 inverse이 예에서는)를 공칭 플롯 한계 이상으로 정의해야 합니다.
numpy 선형 보간법의 특정한 경우에서 이 조건은 선택적 키워드 인수 left , right 를 제공 하여 데이터 범위 밖의 값이 플롯 한계를 훨씬 벗어나 매핑 numpy.interp되도록 임의로 시행할 수 있습니다 .
fig, ax = plt.subplots(constrained_layout=True)
xdata = np.arange(1, 11, 0.4)
ydata = np.random.randn(len(xdata))
ax.plot(xdata, ydata, label='Plotted data')

xold = np.arange(0, 11, 0.2)
# fake data set relating x coordinate to another data-derived coordinate.
# xnew must be monotonic, so we sort...
xnew = np.sort(10 * np.exp(-xold / 4) + np.random.randn(len(xold)) / 3)

ax.plot(xold[3:], xnew[3:], label='Transform data')
ax.set_xlabel('X [m]')
ax.legend()


def forward(x):
    return np.interp(x, xold, xnew)


def inverse(x):
    return np.interp(x, xnew, xold)


secax = ax.secondary_xaxis('top', functions=(forward, inverse))
secax.xaxis.set_minor_locator(AutoMinorLocator())
secax.set_xlabel('$X_{other}$')

plt.show()

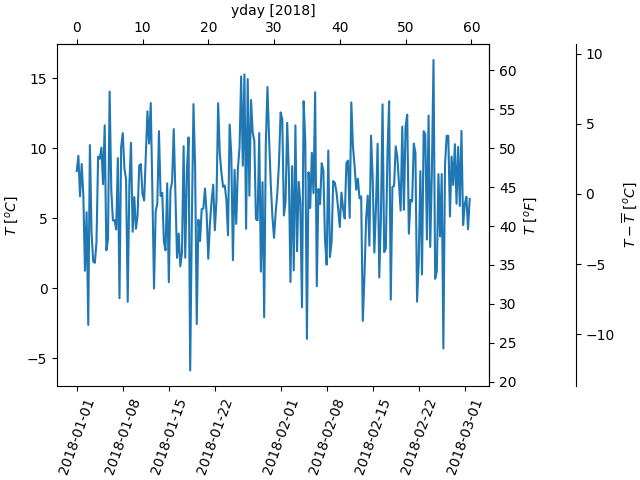
마지막 예제는 x축에서 np.datetime64를 yearday로, y축에서 섭씨에서 화씨로 변환합니다. 세 번째 y축이 추가되었으며 위치 인수에 float를 사용하여 배치할 수 있음에 유의하십시오.
dates = [datetime.datetime(2018, 1, 1) + datetime.timedelta(hours=k * 6)
         for k in range(240)]
temperature = np.random.randn(len(dates)) * 4 + 6.7
fig, ax = plt.subplots(constrained_layout=True)

ax.plot(dates, temperature)
ax.set_ylabel(r'$T\ [^oC]$')
plt.xticks(rotation=70)


def date2yday(x):
    """Convert matplotlib datenum to days since 2018-01-01."""
    y = x - mdates.date2num(datetime.datetime(2018, 1, 1))
    return y


def yday2date(x):
    """Return a matplotlib datenum for *x* days after 2018-01-01."""
    y = x + mdates.date2num(datetime.datetime(2018, 1, 1))
    return y


secax_x = ax.secondary_xaxis('top', functions=(date2yday, yday2date))
secax_x.set_xlabel('yday [2018]')


def celsius_to_fahrenheit(x):
    return x * 1.8 + 32


def fahrenheit_to_celsius(x):
    return (x - 32) / 1.8


secax_y = ax.secondary_yaxis(
    'right', functions=(celsius_to_fahrenheit, fahrenheit_to_celsius))
secax_y.set_ylabel(r'$T\ [^oF]$')


def celsius_to_anomaly(x):
    return (x - np.mean(temperature))


def anomaly_to_celsius(x):
    return (x + np.mean(temperature))


# use of a float for the position:
secax_y2 = ax.secondary_yaxis(
    1.2, functions=(celsius_to_anomaly, anomaly_to_celsius))
secax_y2.set_ylabel(r'$T - \overline{T}\ [^oC]$')


plt.show()

참조
다음 함수, 메서드, 클래스 및 모듈의 사용이 이 예제에 표시됩니다.
스크립트의 총 실행 시간: ( 0분 4.894초)