메모
전체 예제 코드를 다운로드 하려면 여기 를 클릭 하십시오.
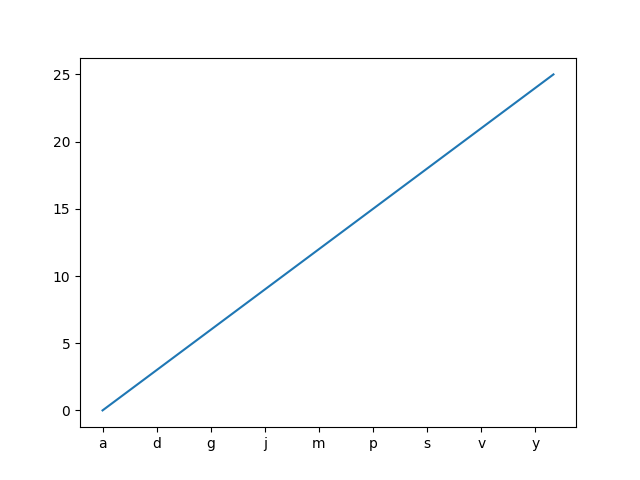
값 목록에서 눈금 레이블 설정 #
를 사용 Axes.set_xticks하면 눈금 레이블이 현재 선택된 눈금에 설정됩니다. 그러나 matplotlib가 눈금 수와 간격을 동적으로 선택하도록 허용할 수 있습니다.
이 경우 눈금 값에서 눈금 레이블을 결정하는 것이 더 나을 수 있습니다. 다음 예제에서는 이를 수행하는 방법을 보여줍니다.
NB: ticker.MaxNLocator여기에서 틱 값이 정수 값을 갖도록 하는 데 사용됩니다.
import matplotlib.pyplot as plt
from matplotlib.ticker import MaxNLocator


fig, ax = plt.subplots()
xs = range(26)
ys = range(26)
labels = list('abcdefghijklmnopqrstuvwxyz')


def format_fn(tick_val, tick_pos):
    if int(tick_val) in xs:
        return labels[int(tick_val)]
    else:
        return ''


# A FuncFormatter is created automatically.
ax.xaxis.set_major_formatter(format_fn)
ax.xaxis.set_major_locator(MaxNLocator(integer=True))
ax.plot(xs, ys)
plt.show()
참조
다음 함수, 메서드, 클래스 및 모듈의 사용이 이 예제에 표시됩니다.