메모
전체 예제 코드를 다운로드 하려면 여기 를 클릭 하십시오.
범례가 있는 산점도 #
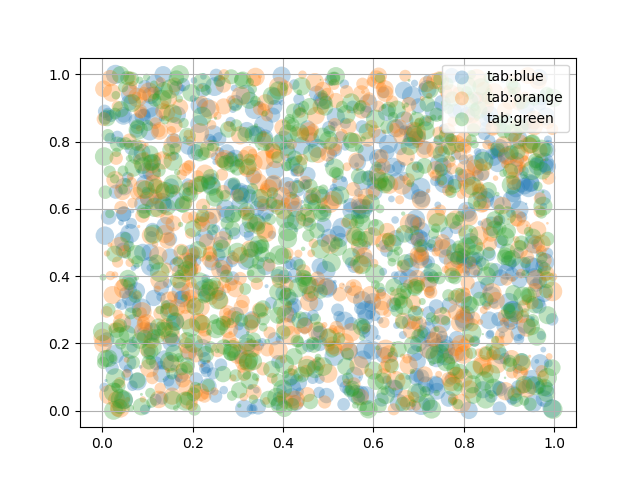
scatter범례가 있는 산점도를 만들려면 루프를 사용하고 항목당 하나의
플롯을 만들어 범례에 표시하고 label
그에 따라 설정할 수 있습니다.
alpha다음은 또한 0과 1 사이의 값 을 지정하여 마커의 투명도를 조정하는 방법을 보여줍니다 .
import numpy as np
import matplotlib.pyplot as plt

np.random.seed(19680801)


fig, ax = plt.subplots()
for color in ['tab:blue', 'tab:orange', 'tab:green']:
    n = 750
    x, y = np.random.rand(2, n)
    scale = 200.0 * np.random.rand(n)
    ax.scatter(x, y, c=color, s=scale, label=color,
               alpha=0.3, edgecolors='none')

ax.legend()
ax.grid(True)

plt.show()

자동화된 범례 생성 #
산포에 대한 범례를 만드는 또 다른 옵션은
PathCollection.legend_elements방법을 사용하는 것입니다. 표시할 범례 항목의 유용한 수를 자동으로 결정하고 핸들과 레이블의 튜플을 반환하려고 시도합니다. 에 대한 호출로 전달할 수 있습니다 legend.
N = 45
x, y = np.random.rand(2, N)
c = np.random.randint(1, 5, size=N)
s = np.random.randint(10, 220, size=N)

fig, ax = plt.subplots()

scatter = ax.scatter(x, y, c=c, s=s)

# produce a legend with the unique colors from the scatter
legend1 = ax.legend(*scatter.legend_elements(),
                    loc="lower left", title="Classes")
ax.add_artist(legend1)

# produce a legend with a cross section of sizes from the scatter
handles, labels = scatter.legend_elements(prop="sizes", alpha=0.6)
legend2 = ax.legend(handles, labels, loc="upper right", title="Sizes")

plt.show()

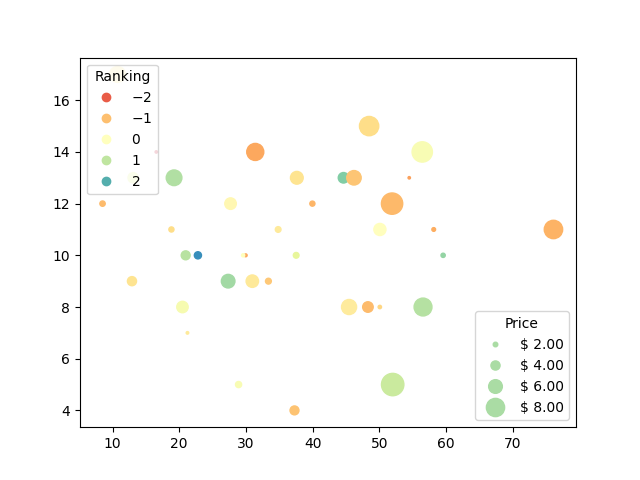
메서드 에 대한 추가 인수를 PathCollection.legend_elements사용하여 생성할 범례 항목 수와 레이블 지정 방법을 조정할 수 있습니다. 다음은 그 중 일부를 사용하는 방법을 보여줍니다.
volume = np.random.rayleigh(27, size=40)
amount = np.random.poisson(10, size=40)
ranking = np.random.normal(size=40)
price = np.random.uniform(1, 10, size=40)

fig, ax = plt.subplots()

# Because the price is much too small when being provided as size for ``s``,
# we normalize it to some useful point sizes, s=0.3*(price*3)**2
scatter = ax.scatter(volume, amount, c=ranking, s=0.3*(price*3)**2,
                     vmin=-3, vmax=3, cmap="Spectral")

# Produce a legend for the ranking (colors). Even though there are 40 different
# rankings, we only want to show 5 of them in the legend.
legend1 = ax.legend(*scatter.legend_elements(num=5),
                    loc="upper left", title="Ranking")
ax.add_artist(legend1)

# Produce a legend for the price (sizes). Because we want to show the prices
# in dollars, we use the *func* argument to supply the inverse of the function
# used to calculate the sizes from above. The *fmt* ensures to show the price
# in dollars. Note how we target at 5 elements here, but obtain only 4 in the
# created legend due to the automatic round prices that are chosen for us.
kw = dict(prop="sizes", num=5, color=scatter.cmap(0.7), fmt="$ {x:.2f}",
          func=lambda s: np.sqrt(s/.3)/3)
legend2 = ax.legend(*scatter.legend_elements(**kw),
                    loc="lower right", title="Price")

plt.show()

참조
다음 함수, 메서드, 클래스 및 모듈의 사용이 이 예제에 표시됩니다.
스크립트의 총 실행 시간: ( 0분 1.840초)