메모
전체 예제 코드를 다운로드 하려면 여기 를 클릭 하십시오.
PatchCollection을 사용하여 오차 막대에서 상자 만들기 #
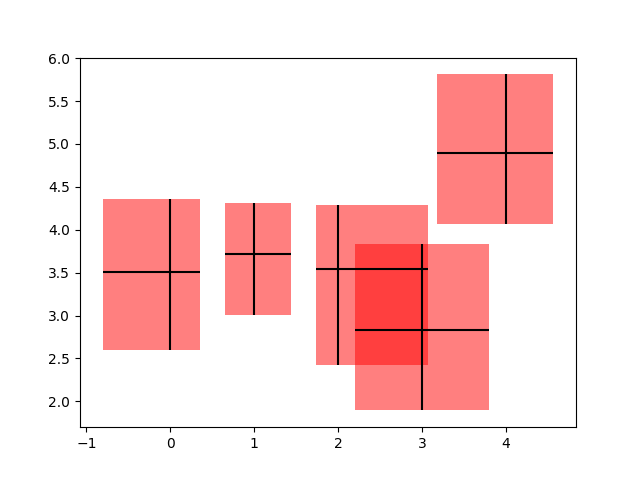
이 예에서는 x 방향과 y 방향 모두에서 막대의 한계로 정의된 직사각형 패치를 추가하여 꽤 표준적인 오류 막대 그림을 멋지게 만듭니다. 이렇게 하려면 이라는 자체 사용자 지정 함수를 작성해야 합니다 make_error_boxes. 이 함수를 면밀히 살펴보면 matplotlib에 대한 함수 작성에서 선호하는 패턴을 알 수 있습니다.
객체 가
Axes함수에 직접 전달됨함수는 인터페이스
Axes를 통하지 않고 메소드에서 직접 작동합니다.pyplot축약될 수 있는 플로팅 키워드 인수는 향후 더 나은 코드 가독성을 위해 철자가 표시됩니다(예: fc 대신 facecolor 사용 ).
플로팅 메서드에 의해 반환된 아티스트
Axes는 함수에 의해 반환되므로 원하는 경우 나중에 함수 외부에서 스타일을 수정할 수 있습니다(이 예제에서는 수정되지 않음).
import numpy as np
import matplotlib.pyplot as plt
from matplotlib.collections import PatchCollection
from matplotlib.patches import Rectangle

# Number of data points
n = 5

# Dummy data
np.random.seed(19680801)
x = np.arange(0, n, 1)
y = np.random.rand(n) * 5.

# Dummy errors (above and below)
xerr = np.random.rand(2, n) + 0.1
yerr = np.random.rand(2, n) + 0.2


def make_error_boxes(ax, xdata, ydata, xerror, yerror, facecolor='r',
                     edgecolor='none', alpha=0.5):

    # Loop over data points; create box from errors at each point
    errorboxes = [Rectangle((x - xe[0], y - ye[0]), xe.sum(), ye.sum())
                  for x, y, xe, ye in zip(xdata, ydata, xerror.T, yerror.T)]

    # Create patch collection with specified colour/alpha
    pc = PatchCollection(errorboxes, facecolor=facecolor, alpha=alpha,
                         edgecolor=edgecolor)

    # Add collection to axes
    ax.add_collection(pc)

    # Plot errorbars
    artists = ax.errorbar(xdata, ydata, xerr=xerror, yerr=yerror,
                          fmt='none', ecolor='k')

    return artists


# Create figure and axes
fig, ax = plt.subplots(1)

# Call function to create error boxes
_ = make_error_boxes(ax, x, y, xerr, yerr)

plt.show()

참조
다음 함수, 메서드, 클래스 및 모듈의 사용이 이 예제에 표시됩니다.