메모
전체 예제 코드를 다운로드 하려면 여기 를 클릭 하십시오.
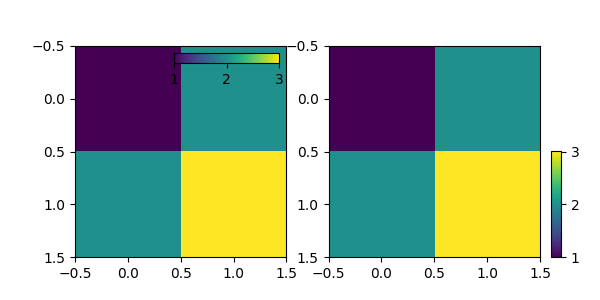
Inset Axes로 컬러바의 위치와 크기 제어하기 #
이 예제에서는 를 사용하여 컬러바의 위치, 높이 및 너비를 제어하는 방법을 보여줍니다 inset_axes.
인셋 축 배치는 범례의 경우와 같이 제어됩니다. loc 옵션("upper right", "best", ...)을 제공하거나 부모 bbox에 대한 locator를 제공합니다. bbox_to_anchor 및 borderpad 와 같은 매개변수 도 같은 방식으로 작동하며 여기에서도 설명됩니다.
import matplotlib.pyplot as plt
from mpl_toolkits.axes_grid1.inset_locator import inset_axes

fig, (ax1, ax2) = plt.subplots(1, 2, figsize=[6, 3])

im1 = ax1.imshow([[1, 2], [2, 3]])
axins1 = inset_axes(
    ax1,
    width="50%",  # width: 50% of parent_bbox width
    height="5%",  # height: 5%
    loc="upper right",
)
axins1.xaxis.set_ticks_position("bottom")
fig.colorbar(im1, cax=axins1, orientation="horizontal", ticks=[1, 2, 3])

im = ax2.imshow([[1, 2], [2, 3]])
axins = inset_axes(
    ax2,
    width="5%",  # width: 5% of parent_bbox width
    height="50%",  # height: 50%
    loc="lower left",
    bbox_to_anchor=(1.05, 0., 1, 1),
    bbox_transform=ax2.transAxes,
    borderpad=0,
)
fig.colorbar(im, cax=axins, ticks=[1, 2, 3])

plt.show()