메모
전체 예제 코드를 다운로드 하려면 여기 를 클릭 하십시오.
로그로그 측면 #
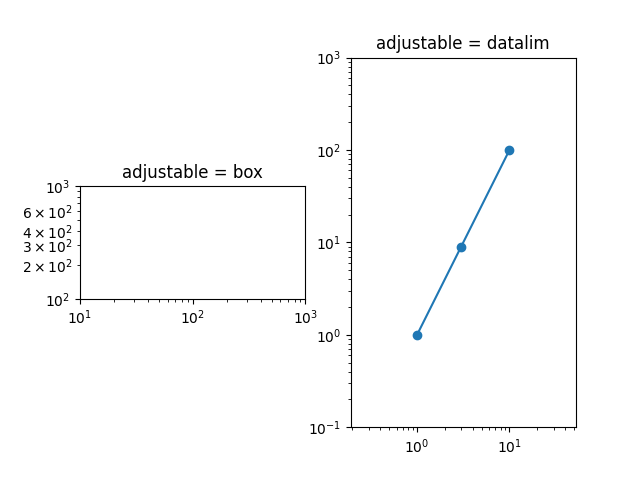
import matplotlib.pyplot as plt

fig, (ax1, ax2) = plt.subplots(1, 2)
ax1.set_xscale("log")
ax1.set_yscale("log")
ax1.set_xlim(1e1, 1e3)
ax1.set_ylim(1e2, 1e3)
ax1.set_aspect(1)
ax1.set_title("adjustable = box")

ax2.set_xscale("log")
ax2.set_yscale("log")
ax2.set_adjustable("datalim")
ax2.plot([1, 3, 10], [1, 9, 100], "o-")
ax2.set_xlim(1e-1, 1e2)
ax2.set_ylim(1e-1, 1e3)
ax2.set_aspect(1)
ax2.set_title("adjustable = datalim")

plt.show()