메모
전체 예제 코드를 다운로드 하려면 여기 를 클릭 하십시오.
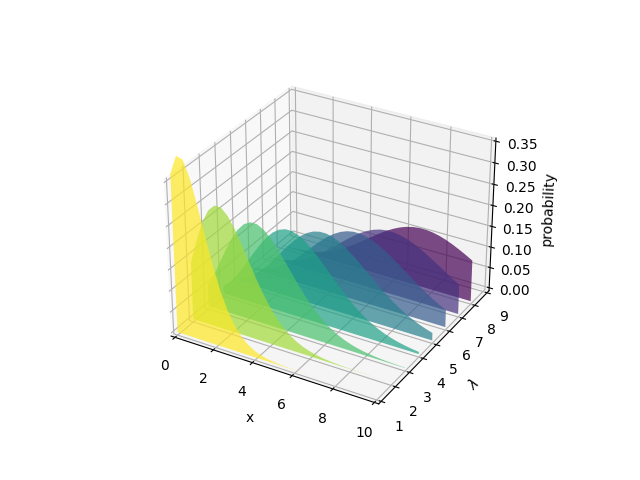
3D 선 그래프 아래에 채울 다각형 생성 #
선 그래프 아래 공간을 채우는 다각형을 만드는 방법을 보여줍니다. 이 예제에서 다각형은 반투명하여 일종의 '들쭉날쭉한 스테인드 글라스' 효과를 만듭니다.
from matplotlib.collections import PolyCollection
import matplotlib.pyplot as plt
import math
import numpy as np

# Fixing random state for reproducibility
np.random.seed(19680801)


def polygon_under_graph(x, y):
    """
    Construct the vertex list which defines the polygon filling the space under
    the (x, y) line graph. This assumes x is in ascending order.
    """
    return [(x[0], 0.), *zip(x, y), (x[-1], 0.)]


ax = plt.figure().add_subplot(projection='3d')

x = np.linspace(0., 10., 31)
lambdas = range(1, 9)

# verts[i] is a list of (x, y) pairs defining polygon i.
gamma = np.vectorize(math.gamma)
verts = [polygon_under_graph(x, l**x * np.exp(-l) / gamma(x + 1))
         for l in lambdas]
facecolors = plt.colormaps['viridis_r'](np.linspace(0, 1, len(verts)))

poly = PolyCollection(verts, facecolors=facecolors, alpha=.7)
ax.add_collection3d(poly, zs=lambdas, zdir='y')

ax.set(xlim=(0, 10), ylim=(1, 9), zlim=(0, 0.35),
       xlabel='x', ylabel=r'$\lambda$', zlabel='probability')

plt.show()