메모
전체 예제 코드를 다운로드 하려면 여기 를 클릭 하십시오.
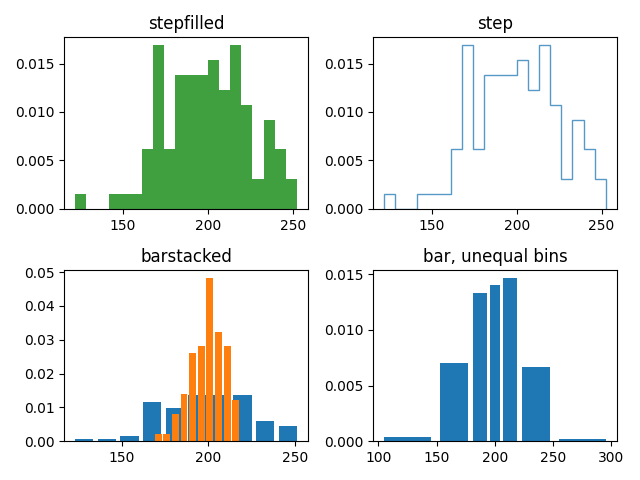
히스토그램 기능의 다양한 histtype설정 데모 #
색상 채우기가 있는 단계 곡선이 있는 히스토그램.
채우기가 없는 단계 곡선이 있는 히스토그램.
사용자 정의 및 동일하지 않은 빈 너비가 있는 히스토그램.
누적 막대가 있는 두 개의 히스토그램.
다른 Bin 도수와 크기를 선택하면 히스토그램의 모양에 상당한 영향을 미칠 수 있습니다. Astropy 문서에는 이러한 매개변수를 선택하는 방법에 대한 훌륭한 섹션이 있습니다. http://docs.astropy.org/en/stable/visualization/histogram.html
import numpy as np
import matplotlib.pyplot as plt

np.random.seed(19680801)

mu_x = 200
sigma_x = 25
x = np.random.normal(mu_x, sigma_x, size=100)

mu_w = 200
sigma_w = 10
w = np.random.normal(mu_w, sigma_w, size=100)

fig, axs = plt.subplots(nrows=2, ncols=2)

axs[0, 0].hist(x, 20, density=True, histtype='stepfilled', facecolor='g',
               alpha=0.75)
axs[0, 0].set_title('stepfilled')

axs[0, 1].hist(x, 20, density=True, histtype='step', facecolor='g',
               alpha=0.75)
axs[0, 1].set_title('step')

axs[1, 0].hist(x, density=True, histtype='barstacked', rwidth=0.8)
axs[1, 0].hist(w, density=True, histtype='barstacked', rwidth=0.8)
axs[1, 0].set_title('barstacked')

# Create a histogram by providing the bin edges (unequally spaced).
bins = [100, 150, 180, 195, 205, 220, 250, 300]
axs[1, 1].hist(x, bins, density=True, histtype='bar', rwidth=0.8)
axs[1, 1].set_title('bar, unequal bins')

fig.tight_layout()
plt.show()