메모
전체 예제 코드를 다운로드 하려면 여기 를 클릭 하십시오.
마커 참조 #
markerMatplotlib는 플롯 명령의 매개변수를 사용하여 선택되는 여러 범주의 마커를 지원 합니다.
모든 마커 목록은 matplotlib.markers문서를 참조하십시오.
사용 예는 Marker examples 를 참조하십시오 .
from matplotlib.markers import MarkerStyle
import matplotlib.pyplot as plt
from matplotlib.lines import Line2D
from matplotlib.transforms import Affine2D


text_style = dict(horizontalalignment='right', verticalalignment='center',
                  fontsize=12, fontfamily='monospace')
marker_style = dict(linestyle=':', color='0.8', markersize=10,
                    markerfacecolor="tab:blue", markeredgecolor="tab:blue")


def format_axes(ax):
    ax.margins(0.2)
    ax.set_axis_off()
    ax.invert_yaxis()


def split_list(a_list):
    i_half = len(a_list) // 2
    return a_list[:i_half], a_list[i_half:]
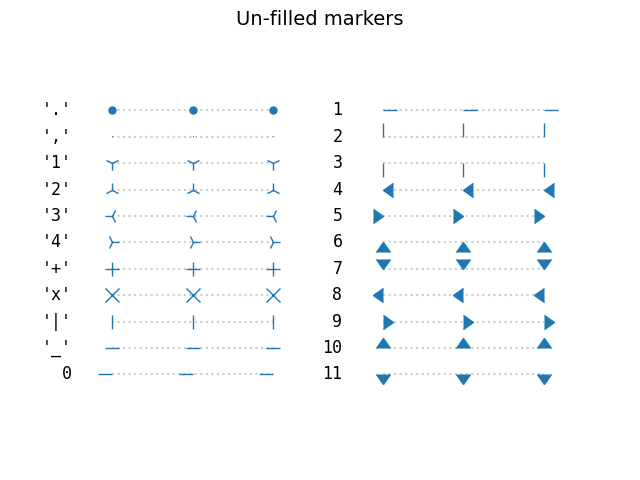
채워지지 않은 마커 #
채워지지 않은 마커는 단색입니다.
fig, axs = plt.subplots(ncols=2)
fig.suptitle('Un-filled markers', fontsize=14)

# Filter out filled markers and marker settings that do nothing.
unfilled_markers = [m for m, func in Line2D.markers.items()
                    if func != 'nothing' and m not in Line2D.filled_markers]

for ax, markers in zip(axs, split_list(unfilled_markers)):
    for y, marker in enumerate(markers):
        ax.text(-0.5, y, repr(marker), **text_style)
        ax.plot([y] * 3, marker=marker, **marker_style)
    format_axes(ax)

plt.show()
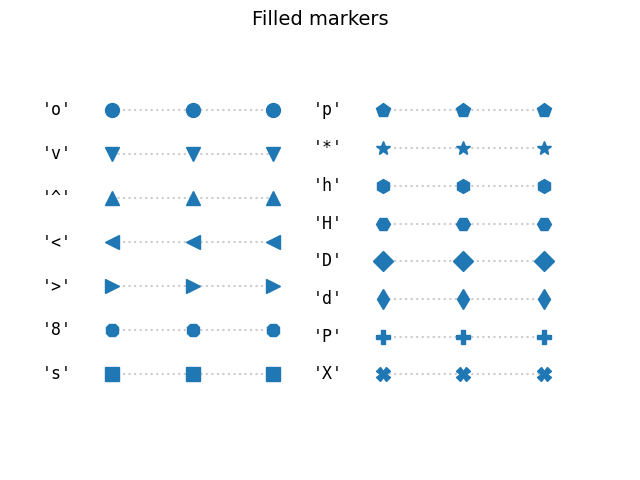
채워진 마커 #
fig, axs = plt.subplots(ncols=2)
fig.suptitle('Filled markers', fontsize=14)
for ax, markers in zip(axs, split_list(Line2D.filled_markers)):
    for y, marker in enumerate(markers):
        ax.text(-0.5, y, repr(marker), **text_style)
        ax.plot([y] * 3, marker=marker, **marker_style)
    format_axes(ax)

plt.show()
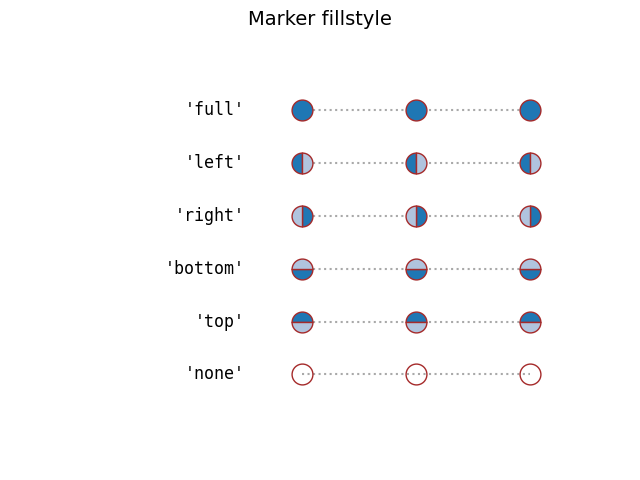
마커 채우기 스타일 #
채워진 마커의 가장자리 색상과 채우기 색상을 별도로 지정할 수 있습니다. 또한 fillstyle다양한 방향으로 비채움, 완전채움 또는 반채움으로 구성할 수 있습니다. 절반만 채워진 스타일
markerfacecoloralt은 보조 채우기 색상으로 사용됩니다.
fig, ax = plt.subplots()
fig.suptitle('Marker fillstyle', fontsize=14)
fig.subplots_adjust(left=0.4)

filled_marker_style = dict(marker='o', linestyle=':', markersize=15,
                           color='darkgrey',
                           markerfacecolor='tab:blue',
                           markerfacecoloralt='lightsteelblue',
                           markeredgecolor='brown')

for y, fill_style in enumerate(Line2D.fillStyles):
    ax.text(-0.5, y, repr(fill_style), **text_style)
    ax.plot([y] * 3, fillstyle=fill_style, **filled_marker_style)
format_axes(ax)

plt.show()
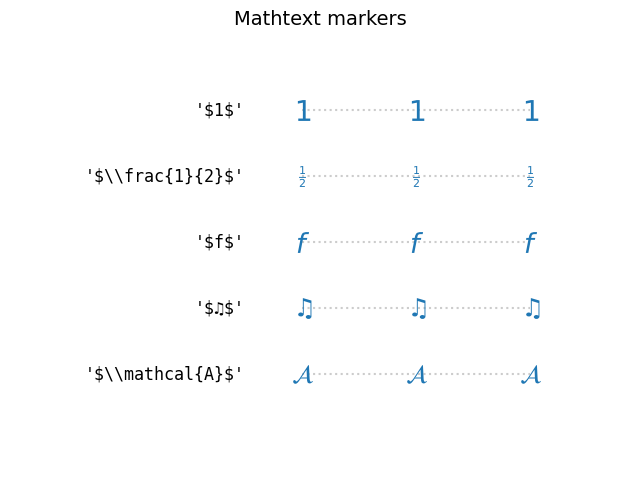
TeX 기호로 만든 마커 #
예를 들어 와 같은 사용자 지정 마커 기호를 사용 하려면 MathText"$\u266B$" 를 사용하십시오 . STIX 글꼴 기호에 대한 개요는 STIX 글꼴 표 를 참조하십시오 . 또한 STIX 글꼴 을 참조하십시오 .
fig, ax = plt.subplots()
fig.suptitle('Mathtext markers', fontsize=14)
fig.subplots_adjust(left=0.4)

marker_style.update(markeredgecolor="none", markersize=15)
markers = ["$1$", r"$\frac{1}{2}$", "$f$", "$\u266B$", r"$\mathcal{A}$"]

for y, marker in enumerate(markers):
    # Escape dollars so that the text is written "as is", not as mathtext.
    ax.text(-0.5, y, repr(marker).replace("$", r"\$"), **text_style)
    ax.plot([y] * 3, marker=marker, **marker_style)
format_axes(ax)

plt.show()
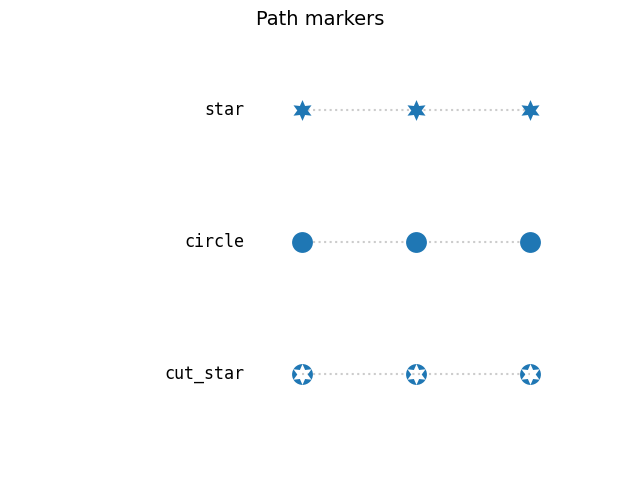
경로에서 생성된 마커 #
모두 마커 Path로 사용할 수 있습니다. 다음 예제에서는 두 개의 간단한 경로 star 및 circle 과 오려낸 별이 있는 원의 보다 정교한 경로를 보여줍니다.
import matplotlib.path as mpath
import numpy as np

star = mpath.Path.unit_regular_star(6)
circle = mpath.Path.unit_circle()
# concatenate the circle with an internal cutout of the star
cut_star = mpath.Path(
    vertices=np.concatenate([circle.vertices, star.vertices[::-1, ...]]),
    codes=np.concatenate([circle.codes, star.codes]))

fig, ax = plt.subplots()
fig.suptitle('Path markers', fontsize=14)
fig.subplots_adjust(left=0.4)

markers = {'star': star, 'circle': circle, 'cut_star': cut_star}

for y, (name, marker) in enumerate(markers.items()):
    ax.text(-0.5, y, name, **text_style)
    ax.plot([y] * 3, marker=marker, **marker_style)
format_axes(ax)

plt.show()
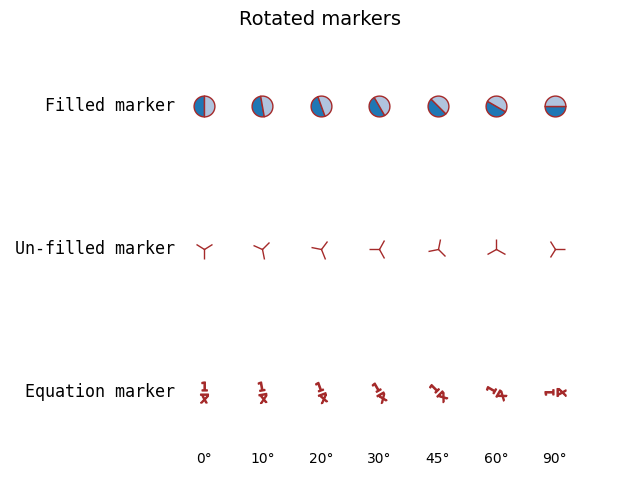
변환을 사용한 고급 마커 수정 #
MarkerStyle 생성자에 변환을 전달하여 마커를 수정할 수 있습니다. 다음 예제는 제공된 회전이 여러 마커 모양에 적용되는 방법을 보여줍니다.
common_style = {k: v for k, v in filled_marker_style.items() if k != 'marker'}
angles = [0, 10, 20, 30, 45, 60, 90]

fig, ax = plt.subplots()
fig.suptitle('Rotated markers', fontsize=14)

ax.text(-0.5, 0, 'Filled marker', **text_style)
for x, theta in enumerate(angles):
    t = Affine2D().rotate_deg(theta)
    ax.plot(x, 0, marker=MarkerStyle('o', 'left', t), **common_style)

ax.text(-0.5, 1, 'Un-filled marker', **text_style)
for x, theta in enumerate(angles):
    t = Affine2D().rotate_deg(theta)
    ax.plot(x, 1, marker=MarkerStyle('1', 'left', t), **common_style)

ax.text(-0.5, 2, 'Equation marker', **text_style)
for x, theta in enumerate(angles):
    t = Affine2D().rotate_deg(theta)
    eq = r'$\frac{1}{x}$'
    ax.plot(x, 2, marker=MarkerStyle(eq, 'left', t), **common_style)

for x, theta in enumerate(angles):
    ax.text(x, 2.5, f"{theta}°", horizontalalignment="center")
format_axes(ax)

fig.tight_layout()
plt.show()
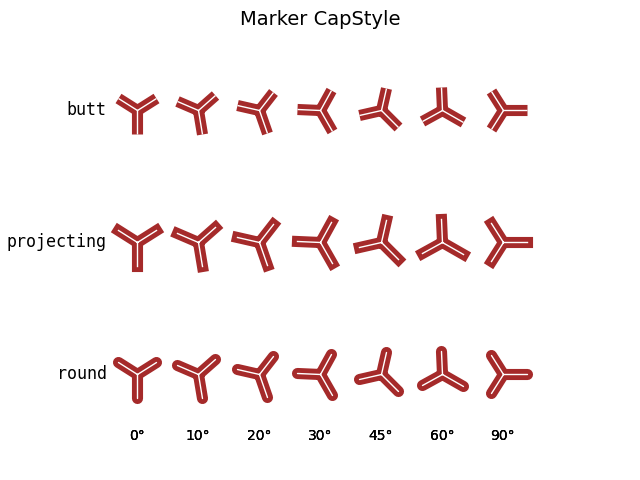
마커 캡 스타일 및 조인 스타일 설정 #
마커에는 기본 캡 및 조인 스타일이 있지만 MarkerStyle을 만들 때 이러한 스타일을 사용자 지정할 수 있습니다.
from matplotlib.markers import JoinStyle, CapStyle

marker_inner = dict(markersize=35,
                    markerfacecolor='tab:blue',
                    markerfacecoloralt='lightsteelblue',
                    markeredgecolor='brown',
                    markeredgewidth=8,
                    )

marker_outer = dict(markersize=35,
                    markerfacecolor='tab:blue',
                    markerfacecoloralt='lightsteelblue',
                    markeredgecolor='white',
                    markeredgewidth=1,
                    )

fig, ax = plt.subplots()
fig.suptitle('Marker CapStyle', fontsize=14)
fig.subplots_adjust(left=0.1)

for y, cap_style in enumerate(CapStyle):
    ax.text(-0.5, y, cap_style.name, **text_style)
    for x, theta in enumerate(angles):
        t = Affine2D().rotate_deg(theta)
        m = MarkerStyle('1', transform=t, capstyle=cap_style)
        ax.plot(x, y, marker=m, **marker_inner)
        ax.plot(x, y, marker=m, **marker_outer)
        ax.text(x, len(CapStyle) - .5, f'{theta}°', ha='center')
format_axes(ax)
plt.show()
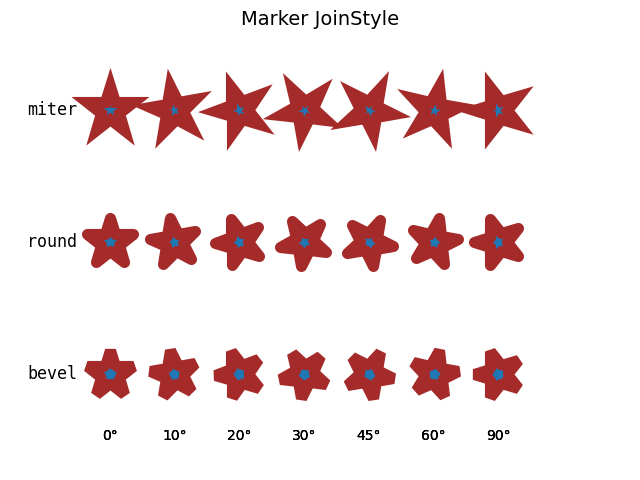
조인 스타일 수정:
fig, ax = plt.subplots()
fig.suptitle('Marker JoinStyle', fontsize=14)
fig.subplots_adjust(left=0.05)

for y, join_style in enumerate(JoinStyle):
    ax.text(-0.5, y, join_style.name, **text_style)
    for x, theta in enumerate(angles):
        t = Affine2D().rotate_deg(theta)
        m = MarkerStyle('*', transform=t, joinstyle=join_style)
        ax.plot(x, y, marker=m, **marker_inner)
        ax.text(x, len(JoinStyle) - .5, f'{theta}°', ha='center')
format_axes(ax)

plt.show()
스크립트의 총 실행 시간: ( 0분 2.550초)