메모
전체 예제 코드를 다운로드 하려면 여기 를 클릭 하십시오.
라벨링 서브플롯 #
하위 플롯에 레이블을 지정하는 것은 비교적 간단하고 다양하므로 Matplotlib에는 이를 수행하는 일반적인 방법이 없습니다.
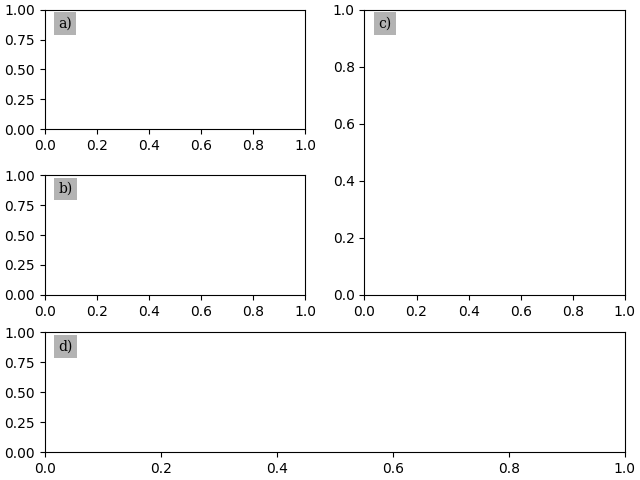
가장 간단한 것은 레이블을 축 안에 넣는 것입니다. 여기서 우리는 pyplot.subplot_mosaic를 사용하고 서브플롯 레이블을 서브플롯의 키로 사용합니다. 이는 매우 편리합니다. 그러나 동일한 방법은 pyplot.subplots서브플롯에 레이블을 지정하려는 것과 다른 키 또는 키와 함께 작동합니다.
import matplotlib.pyplot as plt
import matplotlib.transforms as mtransforms

fig, axs = plt.subplot_mosaic([['a)', 'c)'], ['b)', 'c)'], ['d)', 'd)']],
                              constrained_layout=True)

for label, ax in axs.items():
    # label physical distance in and down:
    trans = mtransforms.ScaledTranslation(10/72, -5/72, fig.dpi_scale_trans)
    ax.text(0.0, 1.0, label, transform=ax.transAxes + trans,
            fontsize='medium', verticalalignment='top', fontfamily='serif',
            bbox=dict(facecolor='0.7', edgecolor='none', pad=3.0))

plt.show()

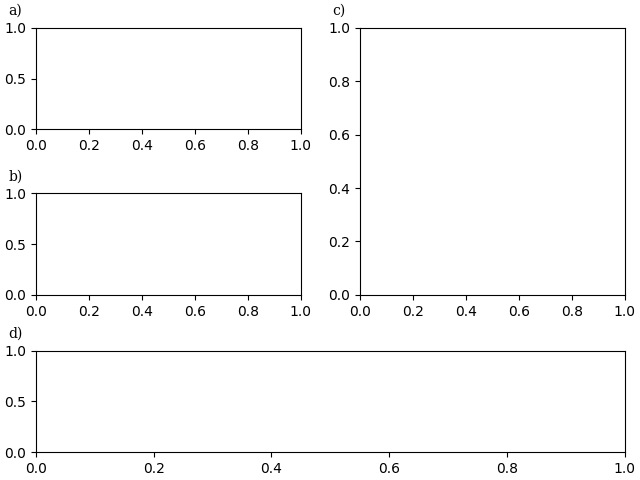
축 외부의 레이블을 선호할 수 있지만 여전히 서로 정렬되어 있습니다. 이 경우 약간 다른 변환을 사용합니다.
fig, axs = plt.subplot_mosaic([['a)', 'c)'], ['b)', 'c)'], ['d)', 'd)']],
                              constrained_layout=True)

for label, ax in axs.items():
    # label physical distance to the left and up:
    trans = mtransforms.ScaledTranslation(-20/72, 7/72, fig.dpi_scale_trans)
    ax.text(0.0, 1.0, label, transform=ax.transAxes + trans,
            fontsize='medium', va='bottom', fontfamily='serif')

plt.show()

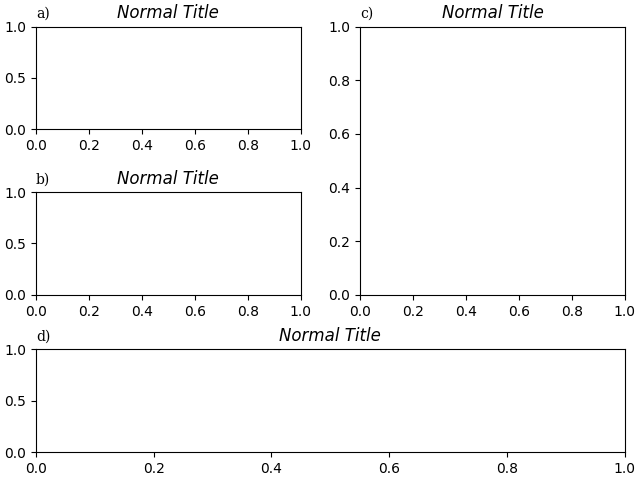
제목에 맞게 정렬하려면 제목에 통합하거나 loc 키워드 인수 를 사용하십시오.
fig, axs = plt.subplot_mosaic([['a)', 'c)'], ['b)', 'c)'], ['d)', 'd)']],
                              constrained_layout=True)

for label, ax in axs.items():
    ax.set_title('Normal Title', fontstyle='italic')
    ax.set_title(label, fontfamily='serif', loc='left', fontsize='medium')

plt.show()

참조
다음 함수, 메서드, 클래스 및 모듈의 사용이 이 예제에 표시됩니다.
스크립트의 총 실행 시간: ( 0분 1.840초)