메모
전체 예제 코드를 다운로드 하려면 여기 를 클릭 하십시오.
레이블 정렬 #
Figure.align_xlabelsand
를 사용하여 xlabel과 ylabel 정렬Figure.align_ylabels
Figure.align_labels이 두 기능을 래핑합니다.
xlabel "XLabel1 1"은 일반적으로 x축에 훨씬 더 가깝고 "YLabel1 0"은 해당 축의 y축에 훨씬 더 가깝습니다.
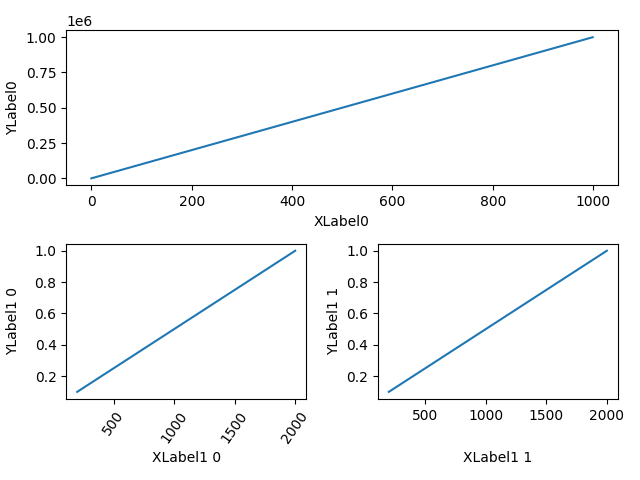
import matplotlib.pyplot as plt
import numpy as np
import matplotlib.gridspec as gridspec

fig = plt.figure(tight_layout=True)
gs = gridspec.GridSpec(2, 2)

ax = fig.add_subplot(gs[0, :])
ax.plot(np.arange(0, 1e6, 1000))
ax.set_ylabel('YLabel0')
ax.set_xlabel('XLabel0')

for i in range(2):
    ax = fig.add_subplot(gs[1, i])
    ax.plot(np.arange(1., 0., -0.1) * 2000., np.arange(1., 0., -0.1))
    ax.set_ylabel('YLabel1 %d' % i)
    ax.set_xlabel('XLabel1 %d' % i)
    if i == 0:
        ax.tick_params(axis='x', rotation=55)
fig.align_labels()  # same as fig.align_xlabels(); fig.align_ylabels()

plt.show()