메모
전체 예제 코드를 다운로드 하려면 여기 를 클릭 하십시오.
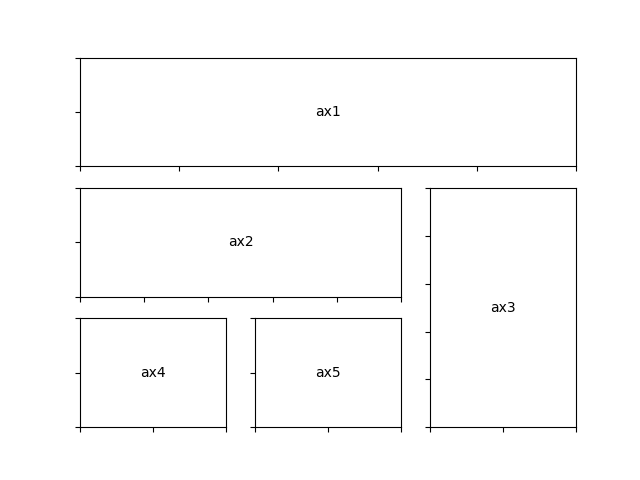
subplot2grid 데모 #
이 예제는 를 사용 pyplot.subplot2grid하여 서브플롯을 생성하는 방법을 보여줍니다. GridSpec 데모GridSpec 에서 설명한 대로 를
사용 하는 것이 일반적으로 선호됩니다.

import matplotlib.pyplot as plt


def annotate_axes(fig):
    for i, ax in enumerate(fig.axes):
        ax.text(0.5, 0.5, "ax%d" % (i+1), va="center", ha="center")
        ax.tick_params(labelbottom=False, labelleft=False)


fig = plt.figure()
ax1 = plt.subplot2grid((3, 3), (0, 0), colspan=3)
ax2 = plt.subplot2grid((3, 3), (1, 0), colspan=2)
ax3 = plt.subplot2grid((3, 3), (1, 2), rowspan=2)
ax4 = plt.subplot2grid((3, 3), (2, 0))
ax5 = plt.subplot2grid((3, 3), (2, 1))

annotate_axes(fig)

plt.show()