메모
전체 예제 코드를 다운로드 하려면 여기 를 클릭 하십시오.
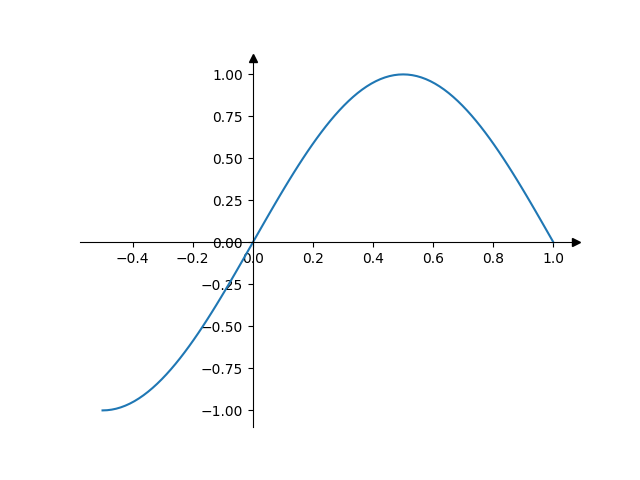
화살표가 있는 가운데 척추 #
이 예제는 척추("축 선")가 및 에 그려지고 끝에 화살표가 있는 "수학 교과서" 스타일 플롯을 그리는 방법을 보여줍니다 .x = 0y = 0

import matplotlib.pyplot as plt
import numpy as np


fig, ax = plt.subplots()
# Move the left and bottom spines to x = 0 and y = 0, respectively.
ax.spines[["left", "bottom"]].set_position(("data", 0))
# Hide the top and right spines.
ax.spines[["top", "right"]].set_visible(False)

# Draw arrows (as black triangles: ">k"/"^k") at the end of the axes.  In each
# case, one of the coordinates (0) is a data coordinate (i.e., y = 0 or x = 0,
# respectively) and the other one (1) is an axes coordinate (i.e., at the very
# right/top of the axes).  Also, disable clipping (clip_on=False) as the marker
# actually spills out of the axes.
ax.plot(1, 0, ">k", transform=ax.get_yaxis_transform(), clip_on=False)
ax.plot(0, 1, "^k", transform=ax.get_xaxis_transform(), clip_on=False)

# Some sample data.
x = np.linspace(-0.5, 1., 100)
ax.plot(x, np.sin(x*np.pi))

plt.show()