메모
전체 예제 코드를 다운로드 하려면 여기 를 클릭 하십시오.
Zorder 데모 #
아티스트의 그리기 순서는 zorder부동 소수점 숫자인 속성에 의해 결정됩니다. 더 높은 아티스트가 zorder맨 위에 그려집니다. 를 설정하여 개별 아티스트의 순서를 변경할 수 있습니다 zorder. 기본값은 아티스트 유형에 따라 다릅니다.
아티스트 |
Z 순서 |
|---|---|
이미지( |
0 |
1 |
|
|
2 |
주요 진드기 |
2.01 |
|
삼 |
5 |
플로팅 메서드에 대한 모든 호출은 해당 특정 항목의 zorder 값을 명시적으로 설정할 수 있습니다.
메모
set_axisbelow및 rcParams["axes.axisbelow"](기본값: 'line')은 눈금 및 그리드 선의 zorder를 설정하는 데 편리한 도우미입니다.
그리기는 한 번 Axes에 수행됩니다. 겹치는 Axes가 있는 경우 두 번째 Axes의 모든 요소는 상대적 zorder와 관계없이 첫 번째 Axes 위에 그려집니다.
다음 예에는 에 Line2D의해 생성된 plot()
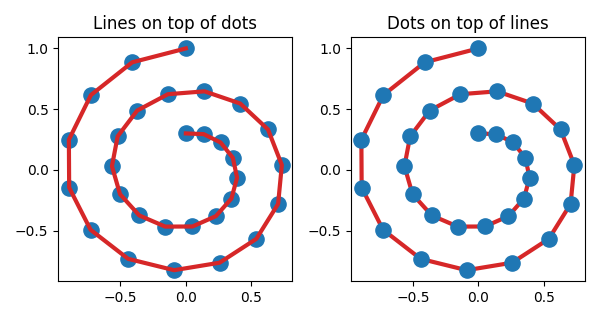
와 에 의해 생성된 점(a PatchCollection)이 포함되어 scatter()있습니다. 따라서 기본적으로 점은 선 아래에 있습니다(첫 번째 하위 그림). 두 번째 서브플롯에서 zorder는 선의 맨 위에 있는 점을 이동하도록 명시적으로 설정됩니다.
fig, (ax1, ax2) = plt.subplots(1, 2, figsize=(6, 3.2))

ax1.plot(x, y, 'C3', lw=3)
ax1.scatter(x, y, s=120)
ax1.set_title('Lines on top of dots')

ax2.plot(x, y, 'C3', lw=3)
ax2.scatter(x, y, s=120, zorder=2.5)  # move dots on top of line
ax2.set_title('Dots on top of lines')

plt.tight_layout()

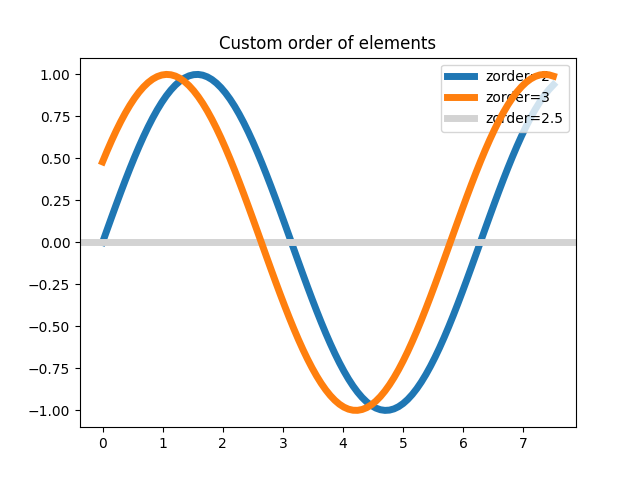
보이는 객체를 생성하는 많은 함수는 zorder매개변수를 허용합니다. 또는 set_zorder()나중에 생성된 개체를 호출할 수 있습니다.
x = np.linspace(0, 7.5, 100)
plt.rcParams['lines.linewidth'] = 5
plt.figure()
plt.plot(x, np.sin(x), label='zorder=2', zorder=2)  # bottom
plt.plot(x, np.sin(x+0.5), label='zorder=3',  zorder=3)
plt.axhline(0, label='zorder=2.5', color='lightgrey', zorder=2.5)
plt.title('Custom order of elements')
l = plt.legend(loc='upper right')
l.set_zorder(2.5)  # legend between blue and orange line
plt.show()
