메모
전체 예제 코드를 다운로드 하려면 여기 를 클릭 하십시오.
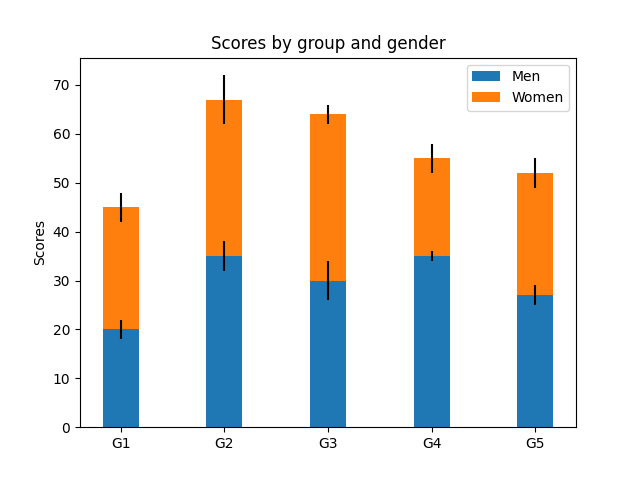
누적 막대 차트 #
를 사용하여 오차 막대가 있는 누적 막대 그래프를 만드는 예입니다 bar. 오차 막대에 사용되는 yerr 매개변수 와 남성용 막대 위에 여성용 막대를 쌓기 위한 bottom 에 유의하십시오.
import matplotlib.pyplot as plt


labels = ['G1', 'G2', 'G3', 'G4', 'G5']
men_means = [20, 35, 30, 35, 27]
women_means = [25, 32, 34, 20, 25]
men_std = [2, 3, 4, 1, 2]
women_std = [3, 5, 2, 3, 3]
width = 0.35       # the width of the bars: can also be len(x) sequence

fig, ax = plt.subplots()

ax.bar(labels, men_means, width, yerr=men_std, label='Men')
ax.bar(labels, women_means, width, yerr=women_std, bottom=men_means,
       label='Women')

ax.set_ylabel('Scores')
ax.set_title('Scores by group and gender')
ax.legend()

plt.show()