메모
전체 예제 코드를 다운로드 하려면 여기 를 클릭 하십시오.
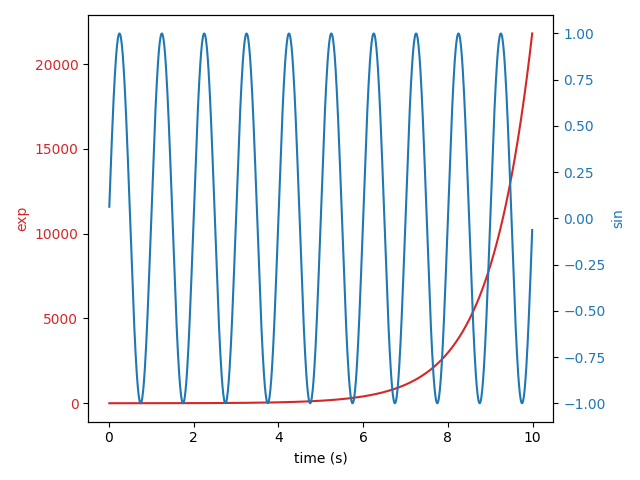
스케일이 다른 플롯 #
왼쪽 및 오른쪽 스케일이 다른 동일한 축에 있는 두 개의 플롯.
요령은 동일한 x 축을 공유하는 두 개의 서로 다른 축을 사용하는 것 입니다. 두 축이 독립적이므로 원하는 대로 별도의 포맷터와 로케이터를 사용할 수 있습니다 .matplotlib.ticker
이러한 축은 Axes.twinx메서드를 호출하여 생성됩니다. 마찬가지로
y 축을 공유하지만 상단 및 하단 스케일이 다른 축을 Axes.twiny생성하는 데 사용할 수 있습니다 .
import numpy as np
import matplotlib.pyplot as plt

# Create some mock data
t = np.arange(0.01, 10.0, 0.01)
data1 = np.exp(t)
data2 = np.sin(2 * np.pi * t)

fig, ax1 = plt.subplots()

color = 'tab:red'
ax1.set_xlabel('time (s)')
ax1.set_ylabel('exp', color=color)
ax1.plot(t, data1, color=color)
ax1.tick_params(axis='y', labelcolor=color)

ax2 = ax1.twinx()  # instantiate a second axes that shares the same x-axis

color = 'tab:blue'
ax2.set_ylabel('sin', color=color)  # we already handled the x-label with ax1
ax2.plot(t, data2, color=color)
ax2.tick_params(axis='y', labelcolor=color)

fig.tight_layout()  # otherwise the right y-label is slightly clipped
plt.show()
참조
다음 함수, 메서드, 클래스 및 모듈의 사용이 이 예제에 표시됩니다.