메모
전체 예제 코드를 다운로드 하려면 여기 를 클릭 하십시오.
주석이 달린 히트맵 만들기 #
두 개의 독립 변수에 따라 달라지는 데이터를 색상으로 구분된 이미지 플롯으로 표시하는 것이 종종 바람직합니다. 이것을 종종 히트맵이라고 합니다. 데이터가 범주형이면 범주형 히트맵이라고 합니다.
Matplotlib의 imshow기능을 사용하면 이러한 플롯을 특히 쉽게 생성할 수 있습니다.
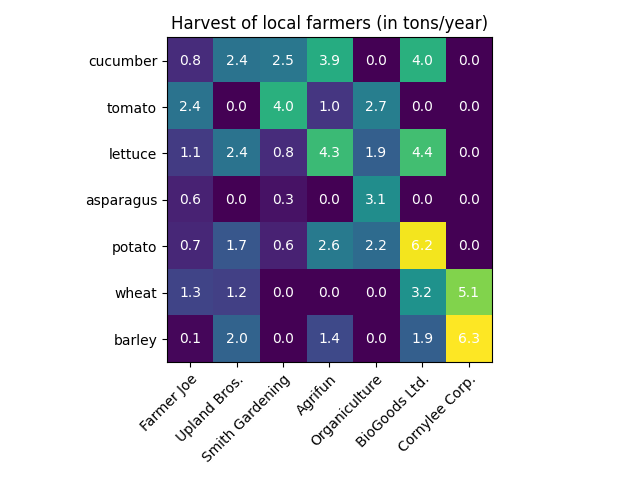
다음 예는 주석이 있는 히트맵을 만드는 방법을 보여줍니다. 쉬운 예제부터 시작하여 범용 함수로 사용할 수 있도록 확장합니다.
간단한 범주형 히트맵 #
일부 데이터를 정의하여 시작할 수 있습니다. 우리에게 필요한 것은 데이터를 색상 코드로 정의하는 2D 목록 또는 배열입니다. 그런 다음 두 개의 목록 또는 범주 배열도 필요합니다. 물론 해당 목록의 요소 수는 각 축을 따라 데이터와 일치해야 합니다. 히트맵 자체는 imshow우리가 가지고 있는 범주로 설정된 레이블이 있는 플롯입니다. set_xticks눈금 위치( )와 눈금 레이블( ) 을 모두 설정하는 것이 중요합니다 set_xticklabels. 그렇지 않으면 동기화되지 않습니다. 위치는 오름차순 정수이고 ticklabels은 표시할 레이블입니다. Text
마지막으로 각 셀 내에 해당 셀의 값을 표시하는 을 생성하여 데이터 자체에 레이블을 지정할 수 있습니다 .
import numpy as np
import matplotlib
import matplotlib as mpl
import matplotlib.pyplot as plt

vegetables = ["cucumber", "tomato", "lettuce", "asparagus",
              "potato", "wheat", "barley"]
farmers = ["Farmer Joe", "Upland Bros.", "Smith Gardening",
           "Agrifun", "Organiculture", "BioGoods Ltd.", "Cornylee Corp."]

harvest = np.array([[0.8, 2.4, 2.5, 3.9, 0.0, 4.0, 0.0],
                    [2.4, 0.0, 4.0, 1.0, 2.7, 0.0, 0.0],
                    [1.1, 2.4, 0.8, 4.3, 1.9, 4.4, 0.0],
                    [0.6, 0.0, 0.3, 0.0, 3.1, 0.0, 0.0],
                    [0.7, 1.7, 0.6, 2.6, 2.2, 6.2, 0.0],
                    [1.3, 1.2, 0.0, 0.0, 0.0, 3.2, 5.1],
                    [0.1, 2.0, 0.0, 1.4, 0.0, 1.9, 6.3]])


fig, ax = plt.subplots()
im = ax.imshow(harvest)

# Show all ticks and label them with the respective list entries
ax.set_xticks(np.arange(len(farmers)), labels=farmers)
ax.set_yticks(np.arange(len(vegetables)), labels=vegetables)

# Rotate the tick labels and set their alignment.
plt.setp(ax.get_xticklabels(), rotation=45, ha="right",
         rotation_mode="anchor")

# Loop over data dimensions and create text annotations.
for i in range(len(vegetables)):
    for j in range(len(farmers)):
        text = ax.text(j, i, harvest[i, j],
                       ha="center", va="center", color="w")

ax.set_title("Harvest of local farmers (in tons/year)")
fig.tight_layout()
plt.show()

도우미 함수 코드 스타일 사용 #
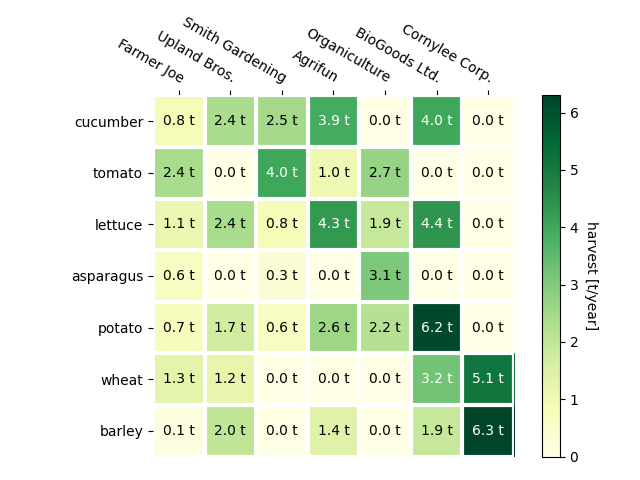
코딩 스타일 에서 논의한 것처럼 이러한 코드를 재사용하여 다른 입력 데이터 및/또는 다른 축에 대한 일종의 히트맵을 생성할 수 있습니다. 데이터와 행 및 열 레이블을 입력으로 사용하고 플롯을 사용자 지정하는 데 사용되는 인수를 허용하는 함수를 만듭니다.
여기에서 위의 내용 외에도 컬러바를 만들고 히트맵 아래가 아닌 위에 레이블을 배치하려고 합니다. 주석은 픽셀 색상 대비 더 나은 대비를 위해 임계값에 따라 다른 색상을 얻습니다. 마지막으로 주변 축의 가시를 끄고 흰색 선 그리드를 만들어 셀을 분리합니다.
def heatmap(data, row_labels, col_labels, ax=None,
            cbar_kw=None, cbarlabel="", **kwargs):
    """
    Create a heatmap from a numpy array and two lists of labels.

    Parameters
    ----------
    data
        A 2D numpy array of shape (M, N).
    row_labels
        A list or array of length M with the labels for the rows.
    col_labels
        A list or array of length N with the labels for the columns.
    ax
        A `matplotlib.axes.Axes` instance to which the heatmap is plotted.  If
        not provided, use current axes or create a new one.  Optional.
    cbar_kw
        A dictionary with arguments to `matplotlib.Figure.colorbar`.  Optional.
    cbarlabel
        The label for the colorbar.  Optional.
    **kwargs
        All other arguments are forwarded to `imshow`.
    """

    if ax is None:
        ax = plt.gca()

    if cbar_kw is None:
        cbar_kw = {}

    # Plot the heatmap
    im = ax.imshow(data, **kwargs)

    # Create colorbar
    cbar = ax.figure.colorbar(im, ax=ax, **cbar_kw)
    cbar.ax.set_ylabel(cbarlabel, rotation=-90, va="bottom")

    # Show all ticks and label them with the respective list entries.
    ax.set_xticks(np.arange(data.shape[1]), labels=col_labels)
    ax.set_yticks(np.arange(data.shape[0]), labels=row_labels)

    # Let the horizontal axes labeling appear on top.
    ax.tick_params(top=True, bottom=False,
                   labeltop=True, labelbottom=False)

    # Rotate the tick labels and set their alignment.
    plt.setp(ax.get_xticklabels(), rotation=-30, ha="right",
             rotation_mode="anchor")

    # Turn spines off and create white grid.
    ax.spines[:].set_visible(False)

    ax.set_xticks(np.arange(data.shape[1]+1)-.5, minor=True)
    ax.set_yticks(np.arange(data.shape[0]+1)-.5, minor=True)
    ax.grid(which="minor", color="w", linestyle='-', linewidth=3)
    ax.tick_params(which="minor", bottom=False, left=False)

    return im, cbar


def annotate_heatmap(im, data=None, valfmt="{x:.2f}",
                     textcolors=("black", "white"),
                     threshold=None, **textkw):
    """
    A function to annotate a heatmap.

    Parameters
    ----------
    im
        The AxesImage to be labeled.
    data
        Data used to annotate.  If None, the image's data is used.  Optional.
    valfmt
        The format of the annotations inside the heatmap.  This should either
        use the string format method, e.g. "$ {x:.2f}", or be a
        `matplotlib.ticker.Formatter`.  Optional.
    textcolors
        A pair of colors.  The first is used for values below a threshold,
        the second for those above.  Optional.
    threshold
        Value in data units according to which the colors from textcolors are
        applied.  If None (the default) uses the middle of the colormap as
        separation.  Optional.
    **kwargs
        All other arguments are forwarded to each call to `text` used to create
        the text labels.
    """

    if not isinstance(data, (list, np.ndarray)):
        data = im.get_array()

    # Normalize the threshold to the images color range.
    if threshold is not None:
        threshold = im.norm(threshold)
    else:
        threshold = im.norm(data.max())/2.

    # Set default alignment to center, but allow it to be
    # overwritten by textkw.
    kw = dict(horizontalalignment="center",
              verticalalignment="center")
    kw.update(textkw)

    # Get the formatter in case a string is supplied
    if isinstance(valfmt, str):
        valfmt = matplotlib.ticker.StrMethodFormatter(valfmt)

    # Loop over the data and create a `Text` for each "pixel".
    # Change the text's color depending on the data.
    texts = []
    for i in range(data.shape[0]):
        for j in range(data.shape[1]):
            kw.update(color=textcolors[int(im.norm(data[i, j]) > threshold)])
            text = im.axes.text(j, i, valfmt(data[i, j], None), **kw)
            texts.append(text)

    return texts
이제 위의 내용을 통해 실제 플롯 생성을 매우 간결하게 유지할 수 있습니다.
fig, ax = plt.subplots()

im, cbar = heatmap(harvest, vegetables, farmers, ax=ax,
                   cmap="YlGn", cbarlabel="harvest [t/year]")
texts = annotate_heatmap(im, valfmt="{x:.1f} t")

fig.tight_layout()
plt.show()

좀 더 복잡한 히트맵 예시 #
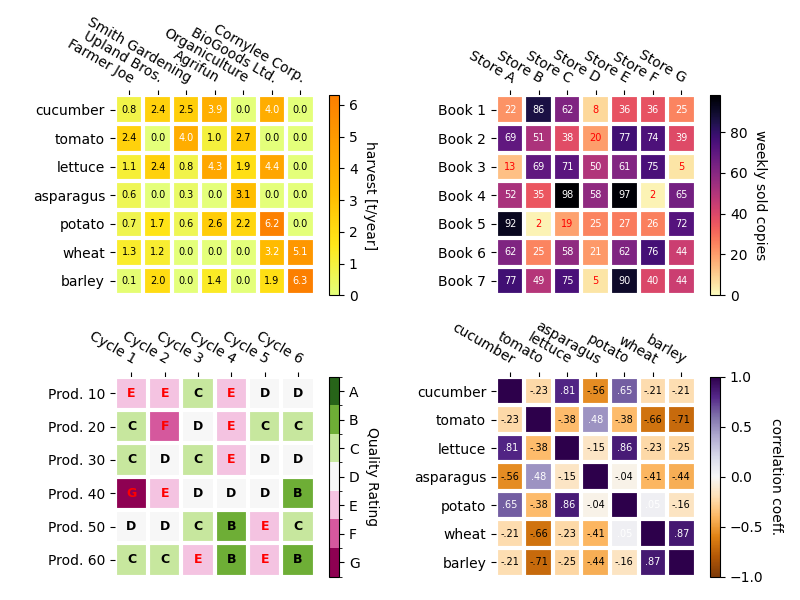
다음에서는 이전에 만든 함수를 다른 경우에 적용하고 다른 인수를 사용하여 다재다능함을 보여줍니다.
np.random.seed(19680801)

fig, ((ax, ax2), (ax3, ax4)) = plt.subplots(2, 2, figsize=(8, 6))

# Replicate the above example with a different font size and colormap.

im, _ = heatmap(harvest, vegetables, farmers, ax=ax,
                cmap="Wistia", cbarlabel="harvest [t/year]")
annotate_heatmap(im, valfmt="{x:.1f}", size=7)

# Create some new data, give further arguments to imshow (vmin),
# use an integer format on the annotations and provide some colors.

data = np.random.randint(2, 100, size=(7, 7))
y = ["Book {}".format(i) for i in range(1, 8)]
x = ["Store {}".format(i) for i in list("ABCDEFG")]
im, _ = heatmap(data, y, x, ax=ax2, vmin=0,
                cmap="magma_r", cbarlabel="weekly sold copies")
annotate_heatmap(im, valfmt="{x:d}", size=7, threshold=20,
                 textcolors=("red", "white"))

# Sometimes even the data itself is categorical. Here we use a
# `matplotlib.colors.BoundaryNorm` to get the data into classes
# and use this to colorize the plot, but also to obtain the class
# labels from an array of classes.

data = np.random.randn(6, 6)
y = ["Prod. {}".format(i) for i in range(10, 70, 10)]
x = ["Cycle {}".format(i) for i in range(1, 7)]

qrates = list("ABCDEFG")
norm = matplotlib.colors.BoundaryNorm(np.linspace(-3.5, 3.5, 8), 7)
fmt = matplotlib.ticker.FuncFormatter(lambda x, pos: qrates[::-1][norm(x)])

im, _ = heatmap(data, y, x, ax=ax3,
                cmap=mpl.colormaps["PiYG"].resampled(7), norm=norm,
                cbar_kw=dict(ticks=np.arange(-3, 4), format=fmt),
                cbarlabel="Quality Rating")

annotate_heatmap(im, valfmt=fmt, size=9, fontweight="bold", threshold=-1,
                 textcolors=("red", "black"))

# We can nicely plot a correlation matrix. Since this is bound by -1 and 1,
# we use those as vmin and vmax. We may also remove leading zeros and hide
# the diagonal elements (which are all 1) by using a
# `matplotlib.ticker.FuncFormatter`.

corr_matrix = np.corrcoef(harvest)
im, _ = heatmap(corr_matrix, vegetables, vegetables, ax=ax4,
                cmap="PuOr", vmin=-1, vmax=1,
                cbarlabel="correlation coeff.")


def func(x, pos):
    return "{:.2f}".format(x).replace("0.", ".").replace("1.00", "")

annotate_heatmap(im, valfmt=matplotlib.ticker.FuncFormatter(func), size=7)


plt.tight_layout()
plt.show()

참조
다음 함수, 메서드, 클래스 및 모듈의 사용이 이 예제에 표시됩니다.
스크립트의 총 실행 시간: ( 0분 2.652초)