메모
전체 예제 코드를 다운로드 하려면 여기 를 클릭 하십시오.
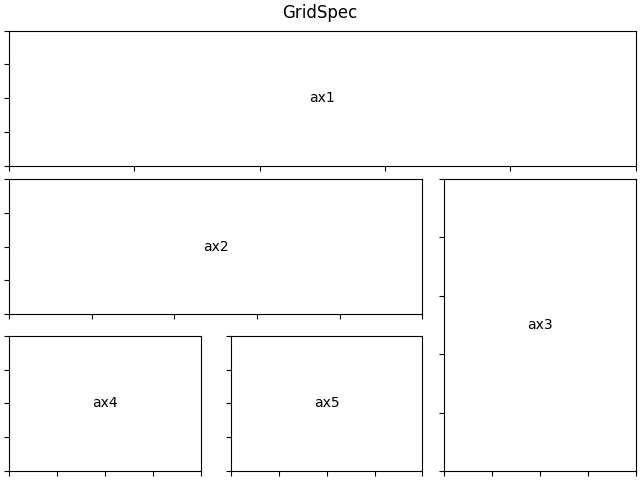
Gridspec을 사용하여 다중 열/행 서브플롯 레이아웃 만들기 #
GridSpec서브플롯 그리드를 배치하는 유연한 방법입니다. 다음은 3x3 그리드와 3열, 2열 및 2행에 걸쳐 있는 축이 있는 예입니다.
import matplotlib.pyplot as plt
from matplotlib.gridspec import GridSpec


def format_axes(fig):
    for i, ax in enumerate(fig.axes):
        ax.text(0.5, 0.5, "ax%d" % (i+1), va="center", ha="center")
        ax.tick_params(labelbottom=False, labelleft=False)

fig = plt.figure(constrained_layout=True)

gs = GridSpec(3, 3, figure=fig)
ax1 = fig.add_subplot(gs[0, :])
# identical to ax1 = plt.subplot(gs.new_subplotspec((0, 0), colspan=3))
ax2 = fig.add_subplot(gs[1, :-1])
ax3 = fig.add_subplot(gs[1:, -1])
ax4 = fig.add_subplot(gs[-1, 0])
ax5 = fig.add_subplot(gs[-1, -2])

fig.suptitle("GridSpec")
format_axes(fig)

plt.show()