메모
전체 예제 코드를 다운로드 하려면 여기 를 클릭 하십시오.
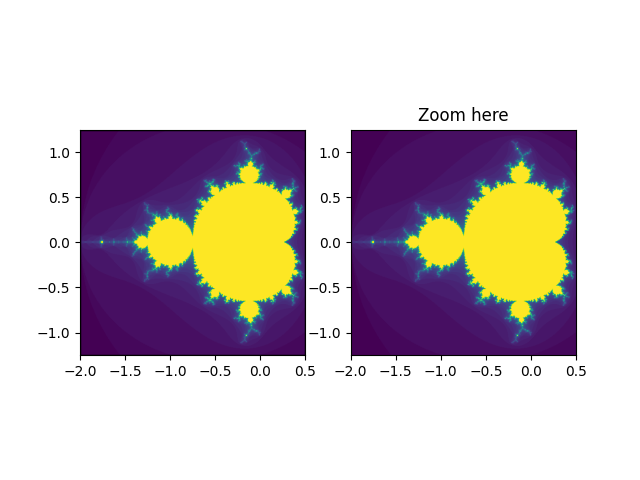
Viewlims #
두 개의 동일한 패널을 만듭니다. 오른쪽 패널을 확대하면 첫 번째 패널에 확대된 영역을 나타내는 사각형이 표시됩니다.
메모
이 예제는 Matplotlib의 대화형 기능을 실행하며 정적 문서에는 나타나지 않습니다. 상호 작용을 보려면 컴퓨터에서 이 코드를 실행하십시오.
개별 부분을 복사하여 붙여넣거나 페이지 하단의 링크를 사용하여 전체 예제를 다운로드할 수 있습니다.
import numpy as np
import matplotlib.pyplot as plt
from matplotlib.patches import Rectangle


# We just subclass Rectangle so that it can be called with an Axes
# instance, causing the rectangle to update its shape to match the
# bounds of the Axes
class UpdatingRect(Rectangle):
    def __call__(self, ax):
        self.set_bounds(*ax.viewLim.bounds)
        ax.figure.canvas.draw_idle()


# A class that will regenerate a fractal set as we zoom in, so that you
# can actually see the increasing detail.  A box in the left panel will show
# the area to which we are zoomed.
class MandelbrotDisplay:
    def __init__(self, h=500, w=500, niter=50, radius=2., power=2):
        self.height = h
        self.width = w
        self.niter = niter
        self.radius = radius
        self.power = power

    def compute_image(self, xstart, xend, ystart, yend):
        self.x = np.linspace(xstart, xend, self.width)
        self.y = np.linspace(ystart, yend, self.height).reshape(-1, 1)
        c = self.x + 1.0j * self.y
        threshold_time = np.zeros((self.height, self.width))
        z = np.zeros(threshold_time.shape, dtype=complex)
        mask = np.ones(threshold_time.shape, dtype=bool)
        for i in range(self.niter):
            z[mask] = z[mask]**self.power + c[mask]
            mask = (np.abs(z) < self.radius)
            threshold_time += mask
        return threshold_time

    def ax_update(self, ax):
        ax.set_autoscale_on(False)  # Otherwise, infinite loop
        # Get the number of points from the number of pixels in the window
        self.width, self.height = \
            np.round(ax.patch.get_window_extent().size).astype(int)
        # Get the range for the new area
        vl = ax.viewLim
        extent = vl.x0, vl.x1, vl.y0, vl.y1
        # Update the image object with our new data and extent
        im = ax.images[-1]
        im.set_data(self.compute_image(*extent))
        im.set_extent(extent)
        ax.figure.canvas.draw_idle()


md = MandelbrotDisplay()
Z = md.compute_image(-2., 0.5, -1.25, 1.25)

fig1, (ax1, ax2) = plt.subplots(1, 2)
ax1.imshow(Z, origin='lower',
           extent=(md.x.min(), md.x.max(), md.y.min(), md.y.max()))
ax2.imshow(Z, origin='lower',
           extent=(md.x.min(), md.x.max(), md.y.min(), md.y.max()))

rect = UpdatingRect(
    [0, 0], 0, 0, facecolor='none', edgecolor='black', linewidth=1.0)
rect.set_bounds(*ax2.viewLim.bounds)
ax1.add_patch(rect)

# Connect for changing the view limits
ax2.callbacks.connect('xlim_changed', rect)
ax2.callbacks.connect('ylim_changed', rect)

ax2.callbacks.connect('xlim_changed', md.ax_update)
ax2.callbacks.connect('ylim_changed', md.ax_update)
ax2.set_title("Zoom here")

plt.show()