메모
전체 예제 코드를 다운로드 하려면 여기 를 클릭 하십시오.
여러 히스토그램을 나란히 생성하기 #
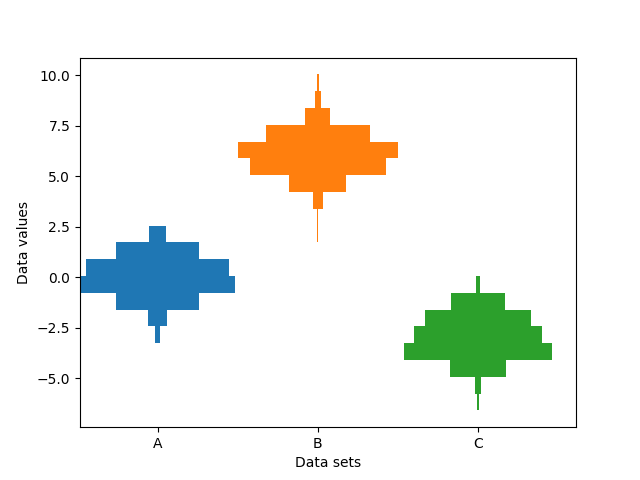
이 예제는 범주형 x축을 따라 다양한 샘플의 가로 히스토그램을 플로팅합니다. 또한 히스토그램은 x 위치에 대해 대칭으로 표시되므로 바이올린 플롯과 매우 유사합니다.
이 고도로 전문화된 플롯을 만들기 위해 표준 hist
방법을 사용할 수 없습니다. 대신 barh수평 막대를 직접 그리는 데 사용합니다. np.histogram막대의 수직 위치와 길이는 함수 를 통해 계산됩니다
. 모든 샘플에 대한 히스토그램은 동일한 범위(최소 및 최대 값)와 빈 수를 사용하여 계산되므로 각 샘플에 대한 빈은 동일한 수직 위치에 있습니다.
다른 Bin 도수와 크기를 선택하면 히스토그램의 모양에 상당한 영향을 미칠 수 있습니다. Astropy 문서에는 이러한 매개변수를 선택하는 방법에 대한 훌륭한 섹션이 있습니다. http://docs.astropy.org/en/stable/visualization/histogram.html
import numpy as np
import matplotlib.pyplot as plt

np.random.seed(19680801)
number_of_bins = 20

# An example of three data sets to compare
number_of_data_points = 387
labels = ["A", "B", "C"]
data_sets = [np.random.normal(0, 1, number_of_data_points),
             np.random.normal(6, 1, number_of_data_points),
             np.random.normal(-3, 1, number_of_data_points)]

# Computed quantities to aid plotting
hist_range = (np.min(data_sets), np.max(data_sets))
binned_data_sets = [
    np.histogram(d, range=hist_range, bins=number_of_bins)[0]
    for d in data_sets
]
binned_maximums = np.max(binned_data_sets, axis=1)
x_locations = np.arange(0, sum(binned_maximums), np.max(binned_maximums))

# The bin_edges are the same for all of the histograms
bin_edges = np.linspace(hist_range[0], hist_range[1], number_of_bins + 1)
heights = np.diff(bin_edges)
centers = bin_edges[:-1] + heights / 2

# Cycle through and plot each histogram
fig, ax = plt.subplots()
for x_loc, binned_data in zip(x_locations, binned_data_sets):
    lefts = x_loc - 0.5 * binned_data
    ax.barh(centers, binned_data, height=heights, left=lefts)

ax.set_xticks(x_locations, labels)

ax.set_ylabel("Data values")
ax.set_xlabel("Data sets")

plt.show()
