메모
전체 예제 코드를 다운로드 하려면 여기 를 클릭 하십시오.
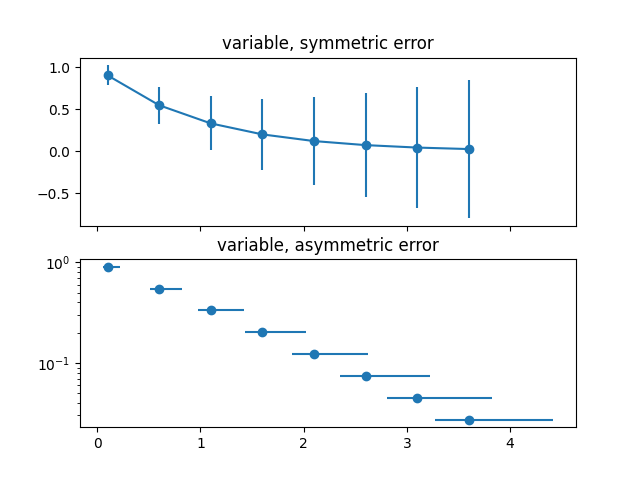
오차 막대를 지정하는 다양한 방법 #
오류는 상수 값으로 지정할 수 있습니다( Errorbar 함수 에 표시됨). 그러나 이 예제에서는 오류 값의 배열을 지정하여 값이 어떻게 달라지는지 보여줍니다.
원시 x및 y데이터의 길이가 N인 경우 두 가지 옵션이 있습니다.
- 모양의 배열(N,):
오류는 각 지점마다 다르지만 오류 값은 대칭입니다(즉, 하위 값과 상위 값이 같음).
- 모양의 배열(2, N):
오차는 점마다 다르며 하한과 상한(순서대로)이 다름(비대칭 경우)
또한 이 예제에서는 오차 막대와 함께 로그 스케일을 사용하는 방법을 보여줍니다.
import numpy as np
import matplotlib.pyplot as plt

# example data
x = np.arange(0.1, 4, 0.5)
y = np.exp(-x)

# example error bar values that vary with x-position
error = 0.1 + 0.2 * x

fig, (ax0, ax1) = plt.subplots(nrows=2, sharex=True)
ax0.errorbar(x, y, yerr=error, fmt='-o')
ax0.set_title('variable, symmetric error')

# error bar values w/ different -/+ errors that
# also vary with the x-position
lower_error = 0.4 * error
upper_error = error
asymmetric_error = [lower_error, upper_error]

ax1.errorbar(x, y, xerr=asymmetric_error, fmt='o')
ax1.set_title('variable, asymmetric error')
ax1.set_yscale('log')
plt.show()